MyPivots
Sign In
JA
jarek
Rep: 94
Posts: 3,474
Looks like no economic news can stop the bulls these days. It would have to be something much, much bigger, but also then they may use it just as another buying opportunity on the way up.
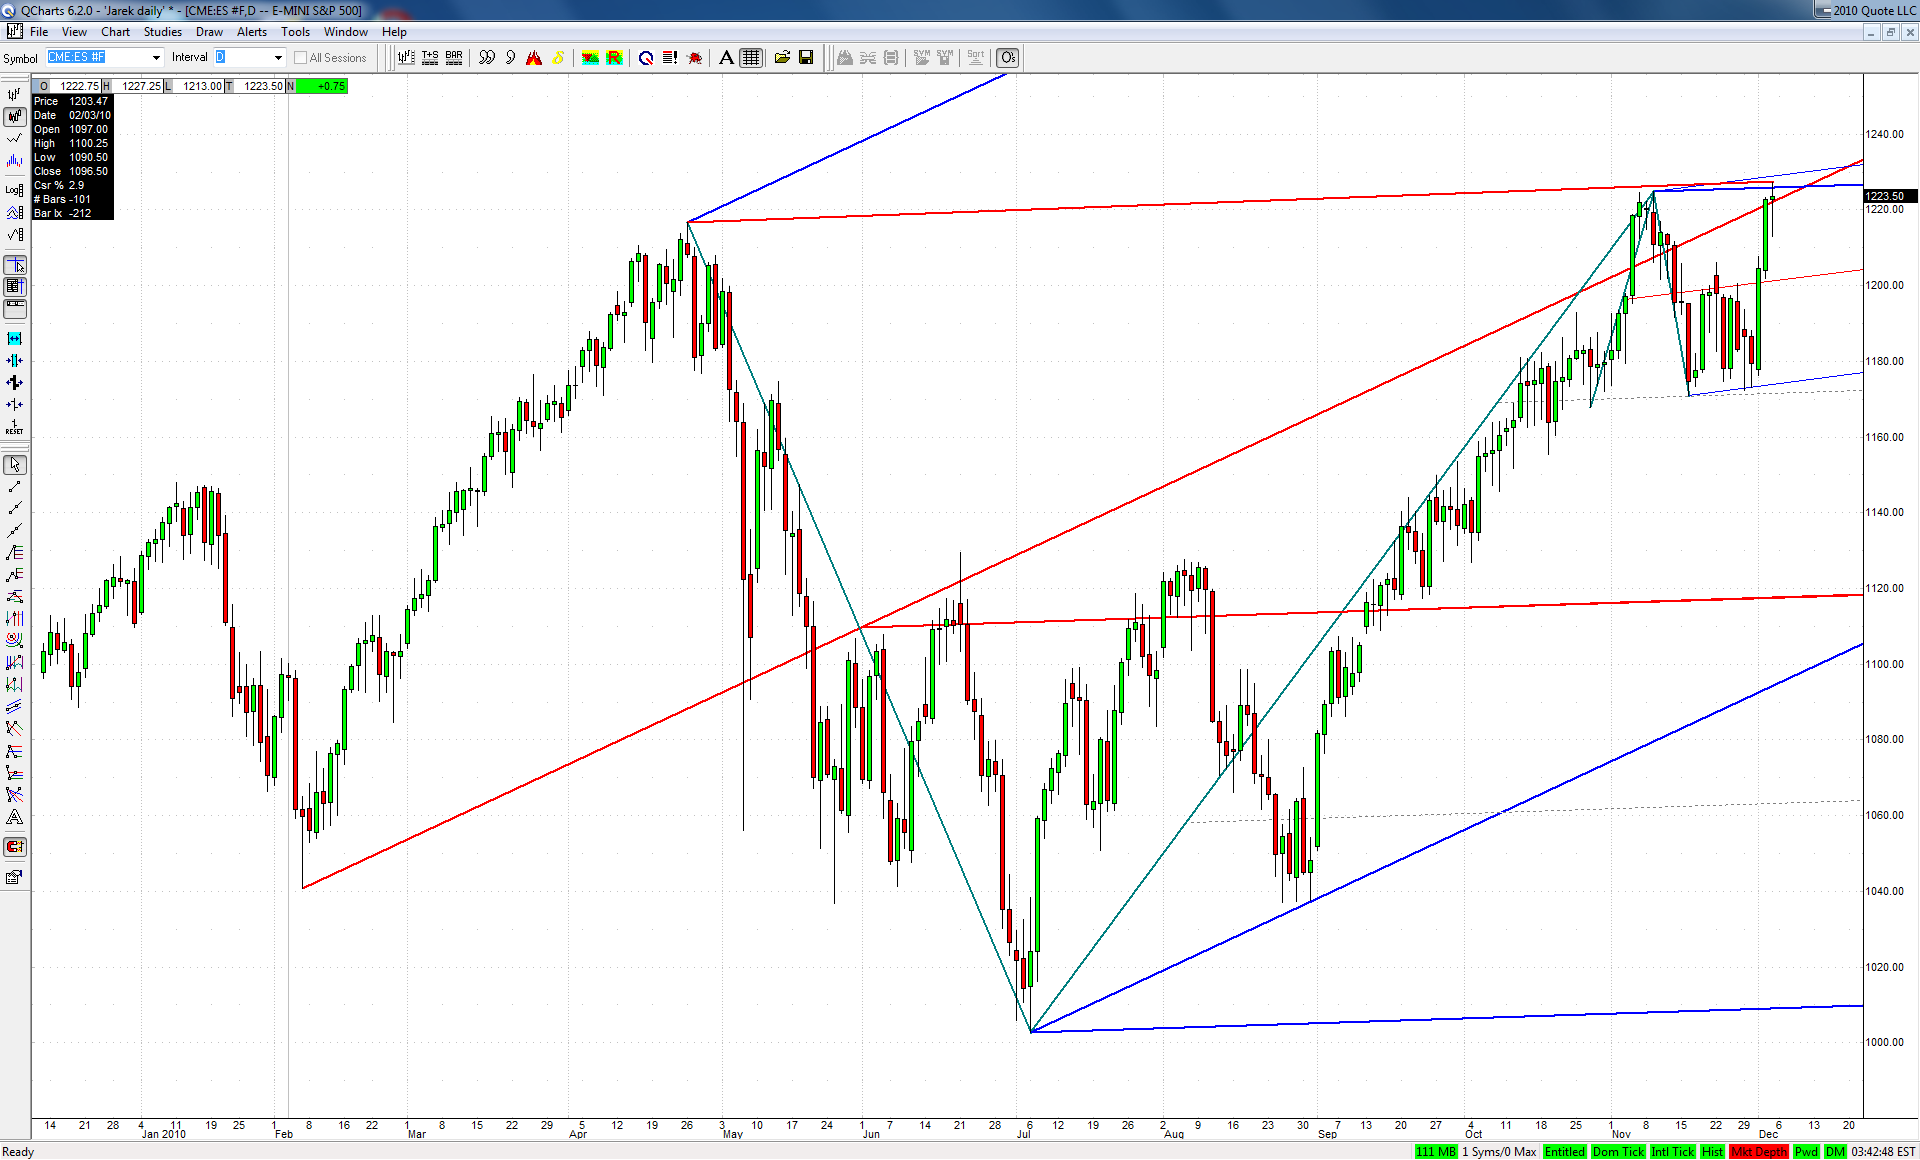
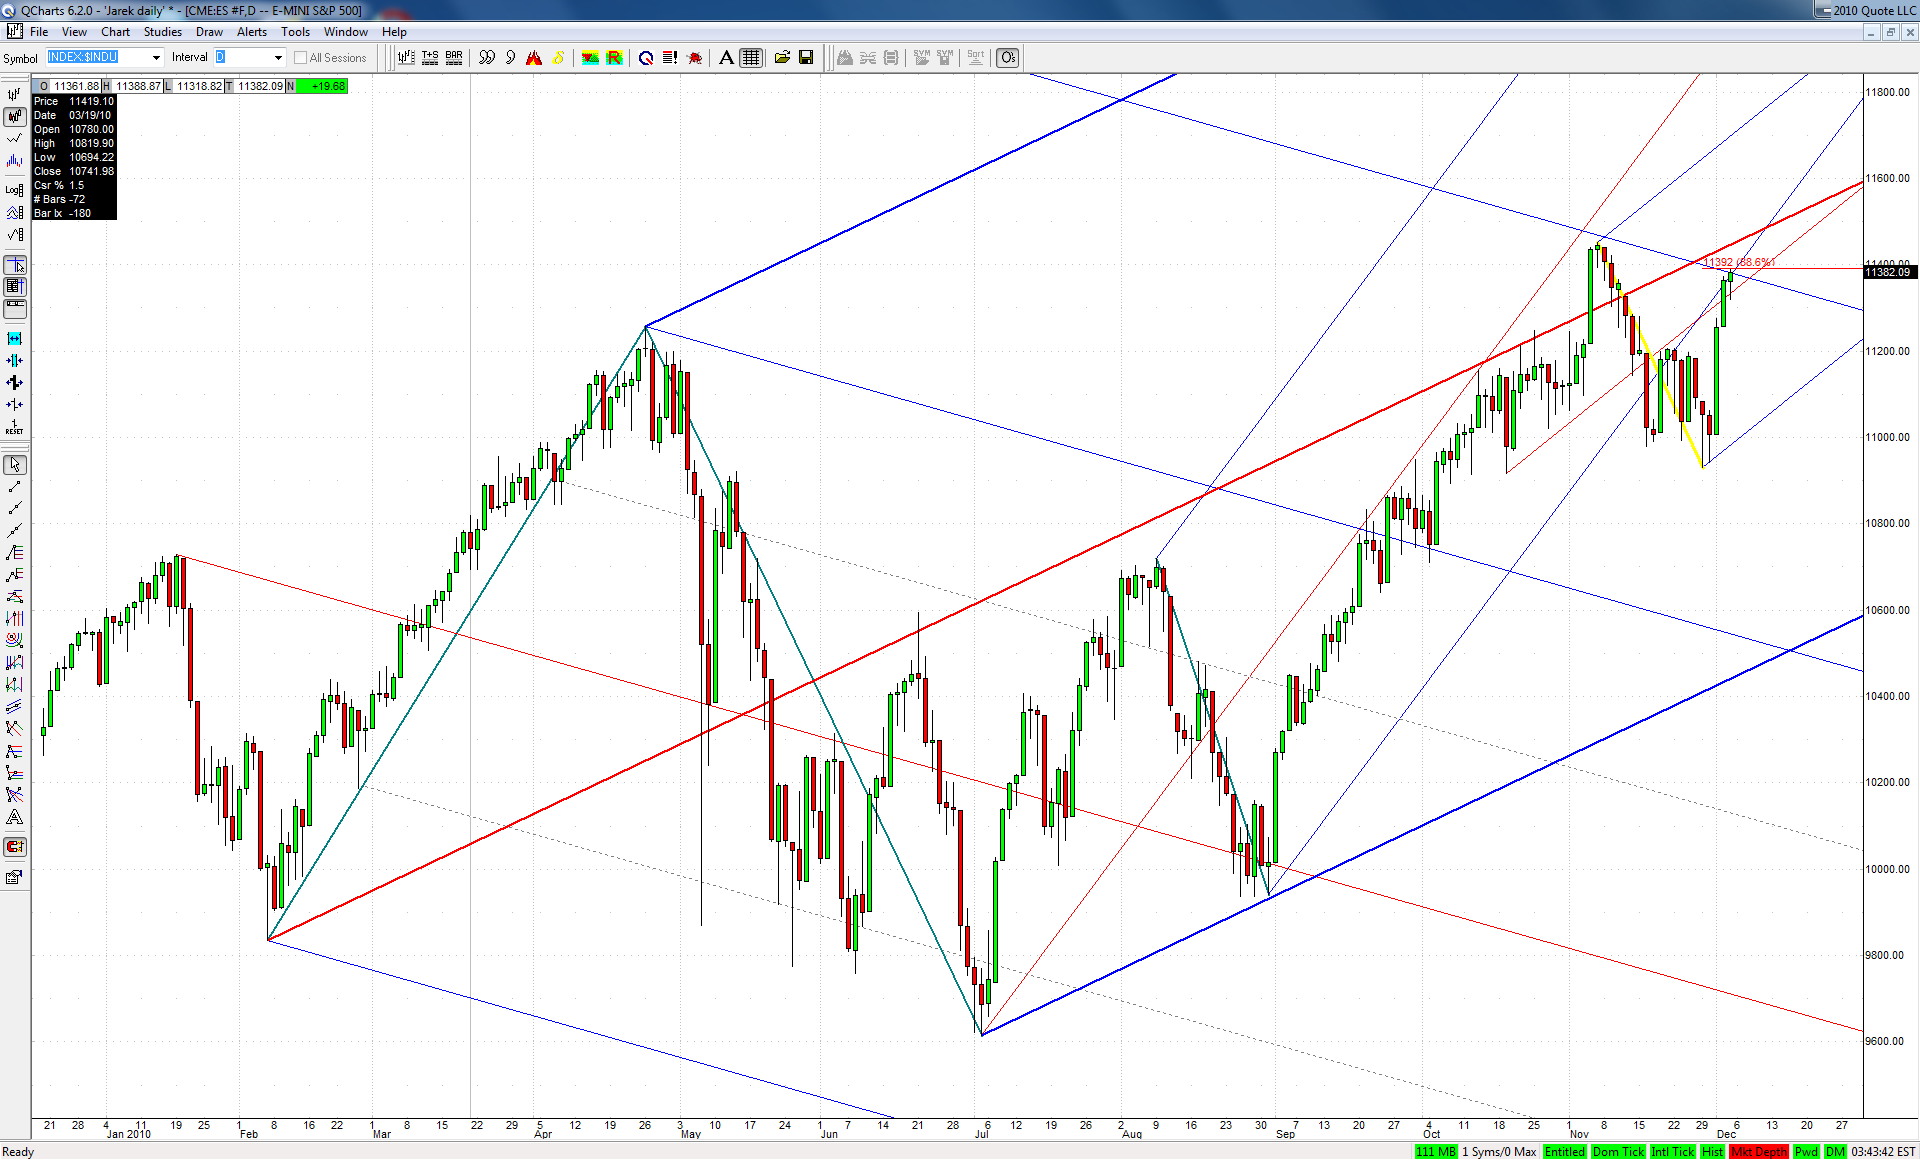
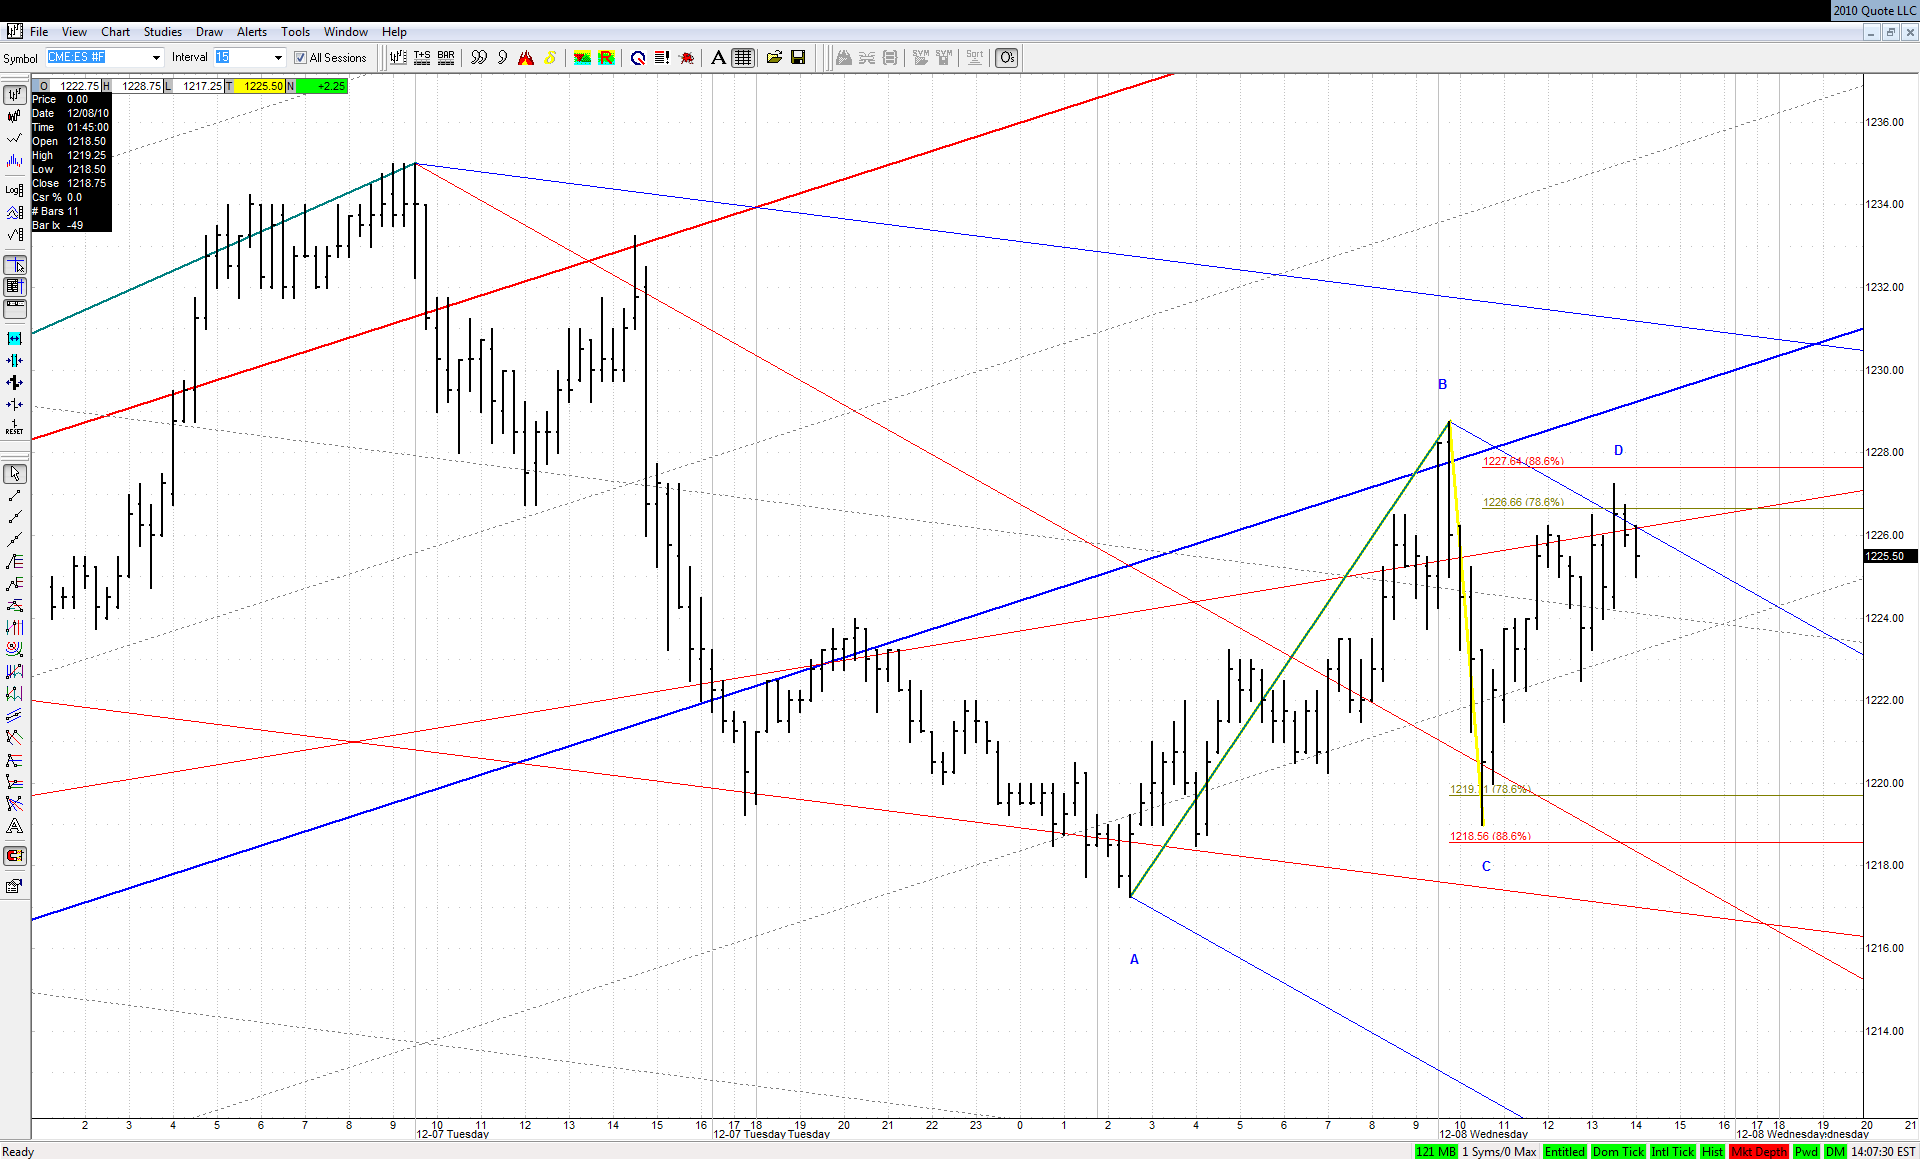
For now let's see how they cope with some little overhead resistance somewhere at current levels:


Click image for original size


Click image for original size
JI
jimkane
Rep: 3,058
Posts: 33,089
Here's Nic's view, lining up with what roofer has been showing. Notice the 3D in gold. This may, indeed, be an epic area. But how they would let it go right before the year end, and mess up those bonuses and yearly returns, I just can't imagine. But it sure is setting up like they are going to let it go.

http://www.zerohedge.com/article/market-hurting-squirting
RO
roofer
Rep: 3,689
Posts: 3,574
looking at all my index charts,i see a stack of kane trend continuation patterns staring back at me....but of course that is right where they would stop it.....just have to slap some stops in and see if my ''big idea'' with bigger targets plays out....
RO
roofer
Rep: 3,689
Posts: 3,574
even now, years later, the simple elegance of what the computers are doing for all to see based on a SPECIFIC GAP and a SPECIFIC FIB is remarkable....

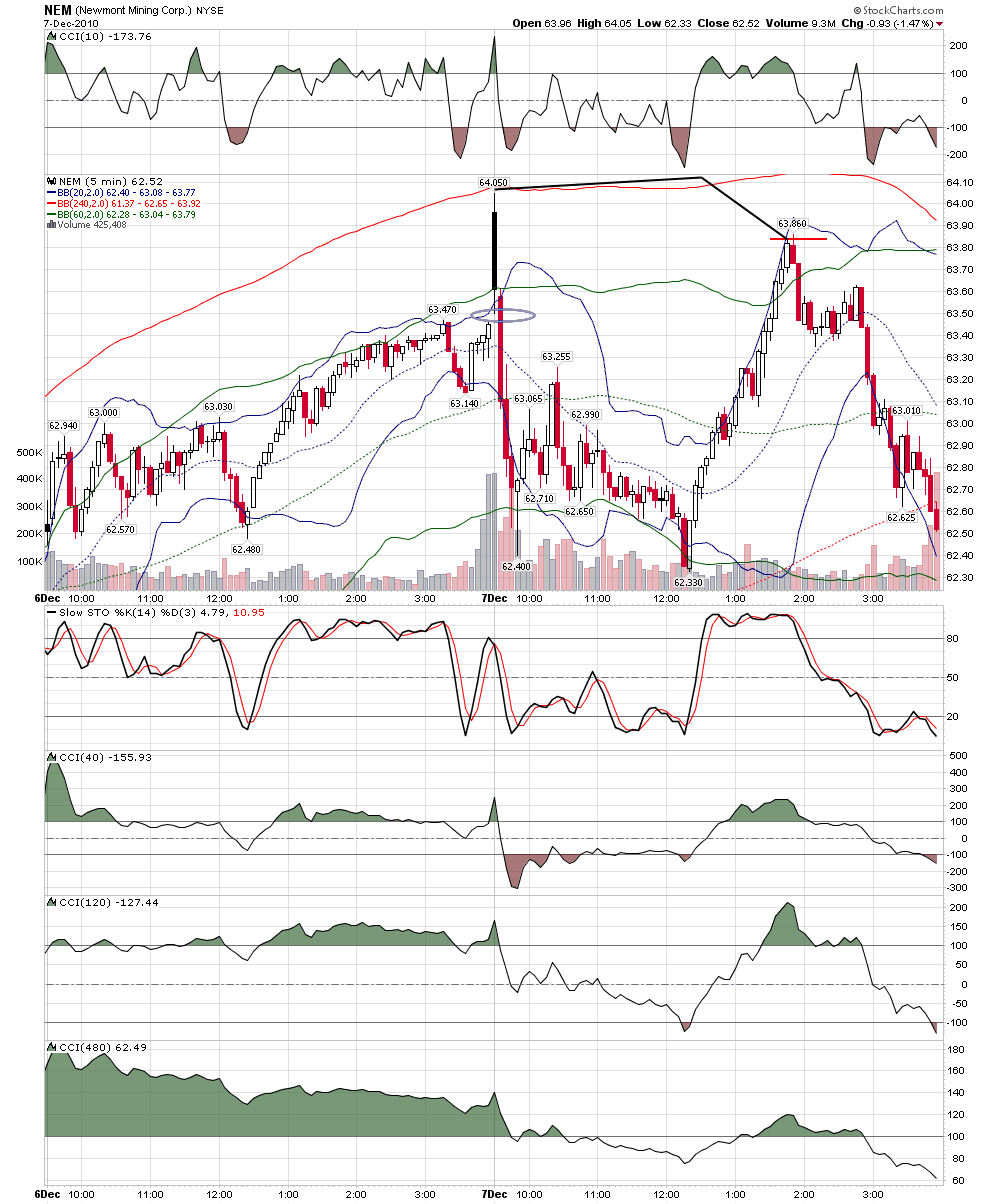
again for me the process was this.jim said the .886 was the most important fib.i said to myself ok, if that is true, then i will record every time price turns at .886 and see if there is a tell, a marker, a common thread on the days it does turn at the .886. i found the connection to be days that price opens on a gap and holds that gap for the first 5 minute bar...but do i think i ''discovered''' anything?no... i simply found what had been going on all along and wrote about it.there is an advantage to having collected my own 3 thousand examples of the setup.i know for myself because i have done the work.
Click image for original size
RO
roofer
Rep: 3,689
Posts: 3,574
again,i am often miffed when people say indicators are a lagging or worthless tool.... if you keep a cci ''stack'' with sto as in above chart,,you will find repeating patterns ..patterns that are now so ingrained in my thinking that i will cover trades based on the odds given by the indicators alone.joed showed me this... but his way is to keep a set of four charts... one day i saw a chart of another trade with multiple cci's... i realized by varying the value of the cci, i could keep all the info i needed on one chart.
JA
jarek
Rep: 94
Posts: 3,474
Thank you for constantly sharing your invaluable insights Geo!
JA
jarek
Rep: 94
Posts: 3,474
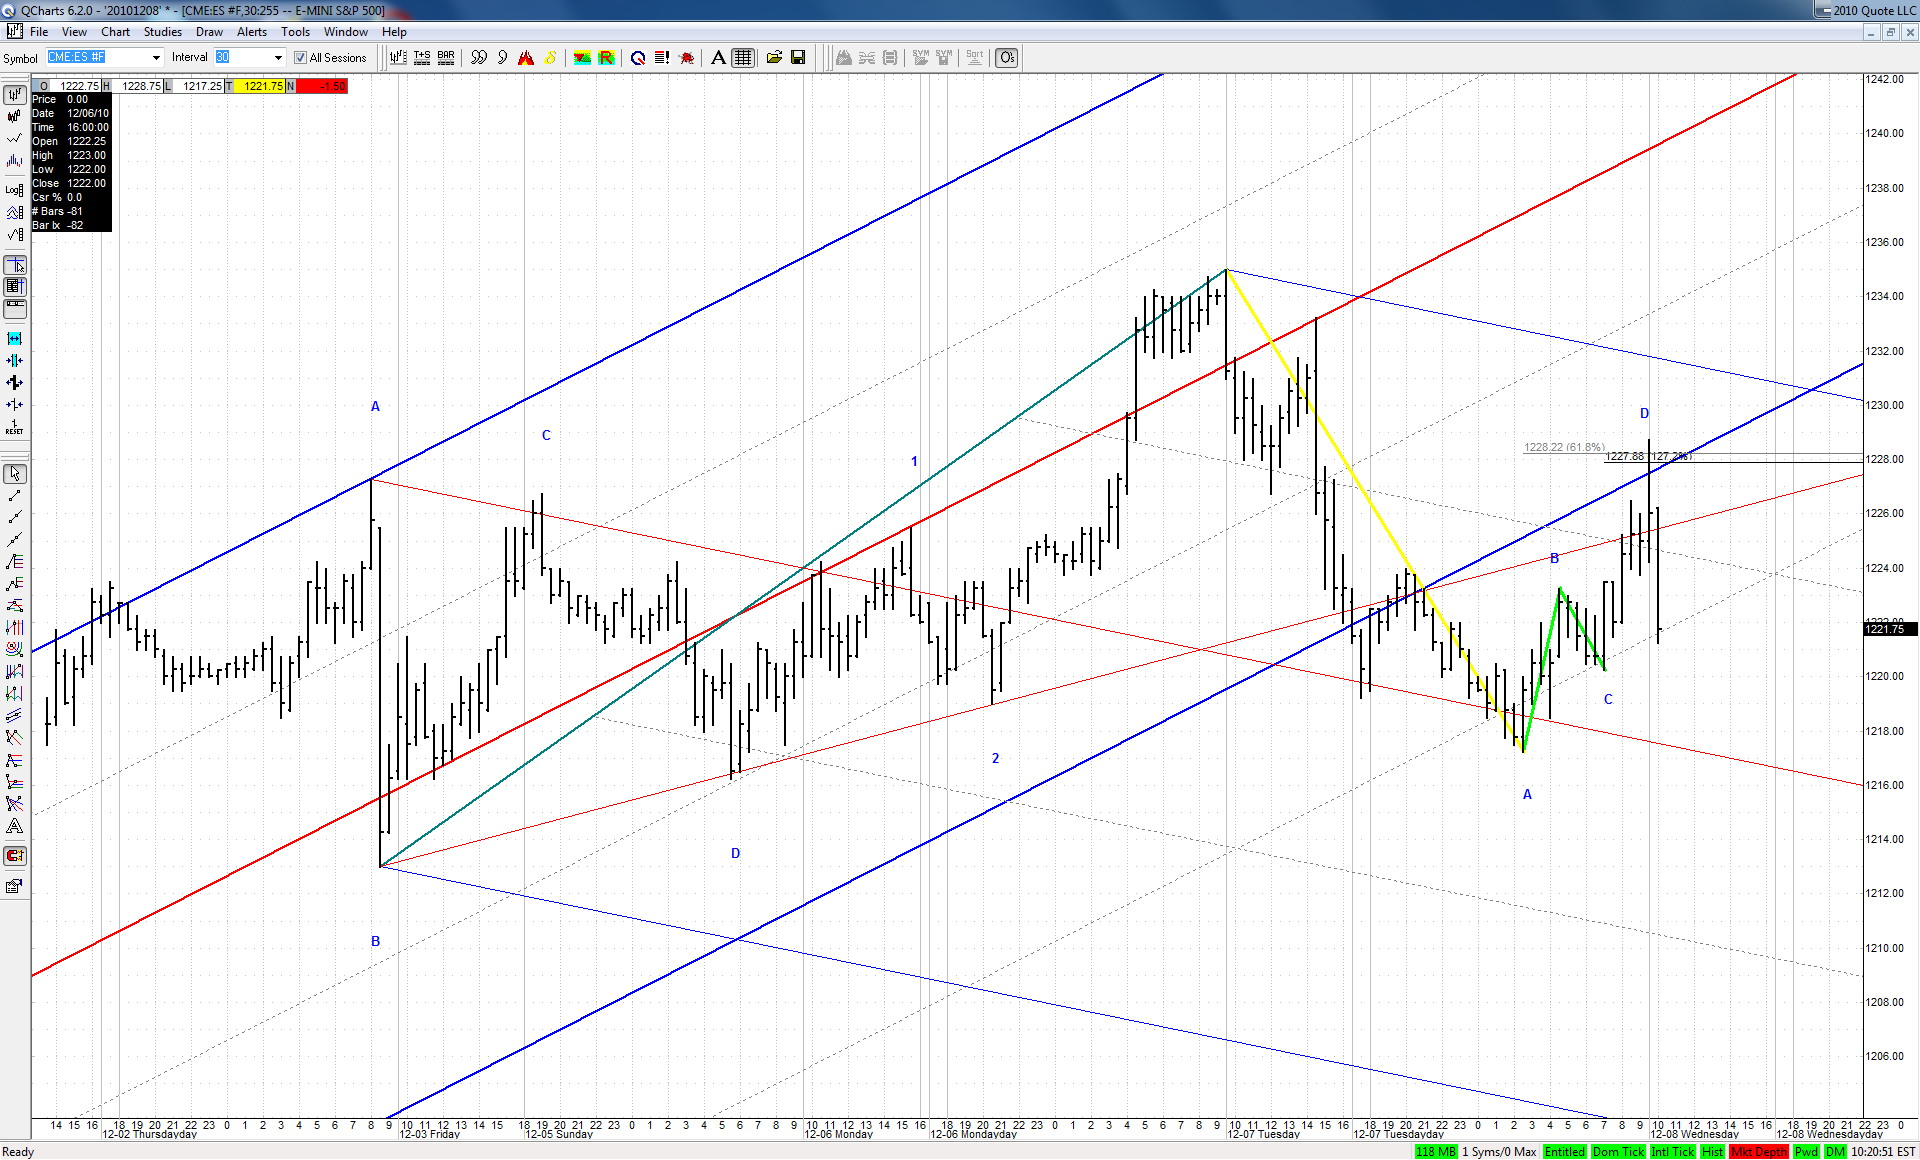
Our yesterday's bullish ABCD failed overnight and now we have a new one - this time a bearish ABCD which back-tested the rising ML:


Click image for original size
JI
jimkane
Rep: 3,058
Posts: 33,089
Greats stuff, guys.

Recall yesterday I was mentioning how the talking heads were only debating how high the S&P would go next year, there wasn't even a hint it could possibly be lower? Byron Wien just came out with his forecast, he says the S&P will take out the record high (1576 cash index). That's about a 350 point increase, almost a 30% pop. Wow, imagine that.
JI
jimkane
Rep: 3,058
Posts: 33,089
Louis Navellier on TV just now: "It's lock and load rally time on Wall Street, and don't expect it to end any time soon." It's just too funny, the parade. Everyone on one side of the boat, the boat is headed into deep water, no one has a life preserver on, and no one is worried...
JA
jarek
Rep: 94
Posts: 3,474
This bearish 4PT is probably bears last chance for anything meaningful to happen in the move off yesterday's high:


Click image for original size
JI
jimkane
Rep: 3,058
Posts: 33,089
Well, I think this is more likely headed for new highs, but notice the very well-formed 5-wave down. Although many corrections are impulsive (Yes, Virginia, there is not only a Santa Claus, but, believe it or not, there are also many 5-wave impulsive corrections), I always look for ABCD's after an impulsive correction, or even a non-ABCD bounce, and possible roll into a bigger ABCD, so the impulsive part is an AB leg. But let me say unequivocally: assuming an impulsive correction, be it 5 waves or otherwise, is more likely an AB leg than an impulsive correction is deadly. It simply isn't so in my experience.

So watch in here for a possible bearish 'W2'. The 1.000 ABCD is at 1230.50. But do all the work. Remember, though, the only way I'd consider a 'W2' is if I thought the start of 'W1' was a full blown PTA and likely reversal spot. How sure are you the top is in? I'm not sure.
JI
jimkane
Rep: 3,058
Posts: 33,089
It had to get one tick higher!
That also got it to the exact 1.272 at 36.20 on that ABCD. So, we got a weekly close essentially at the high tick for the week, the month so far, and the entire 'bulls#$&' market. Those poor bears, still trying to call the top. For me, I'll just keep creating 'ride the long' plays.

It's the bulls time in the sun. I'm not going to fight that. I just saw in a Bloomberg survey not one single analyst was bearish on next year. 100% bulls! I'm seeing 'breakout' and acceleration calls everywhere. Sentiment is extreme for the bulls. It can get more extreme, or stay extreme for a long time. The $VIX is dragging on the lows, but can get lower.

Midcaps one good trading day from new all-time highs. Russell, Transports, etc. right behind Midcaps. The entire drop from the crisis erased, new all-time highs. Unreal. It's the bulls time to shine. Let them enjoy it, as it won't last. The bears will shine again, just not today. Goin' with the flowin'...