ES short term trading 01/06/11
In order to overcome the 1273.50 resistance barrier from this afternoon, I think the ES will need to open gap up and above it.
So for tonight and tomorrows trading: If ES moves above 1272,50, will target 1276.75 as first objective, above 1276.75, 1281.25 as second obj. above 1281.25, 1285.75 as third Obj.
The voiding point for that possible scenario is at 1269.25.
Below 1269.25, 1265.00 is next support.
ES trading 1272.00 @ 22:22
Will see, and as always, the market has the last word and in due time will show us the way.
Some times I'm able to play the tops or bottoms of a 60m bar and some of my conditions to trade it are:
1) 60m bar "open" at support or resistance
2) 60m bar is what could be a "double top" opening at resistance (or double bottom opening at support) .
3) Small time frame oscillators and 60m chart oscillators are in overbought - if double top and hitting resistance - Or oscillators in oversold - if 60M bar is making a double bottom at support-
4) Add the daily chart at a mayor SR with oscillators in the same condition and you got a potential multi-day trade that is just starting.
My protecting stop is usually not to far from the double top or double bottom.
Bruce. As always, thanks for taking the time to share your way of seeing.
Originally posted by BruceM
Here is the 30 minute with a few basic comments....just sharing a few ideas regarding the closes. I'm not a break out trader so I don't advocate using the closes in that way.
Click image for original size
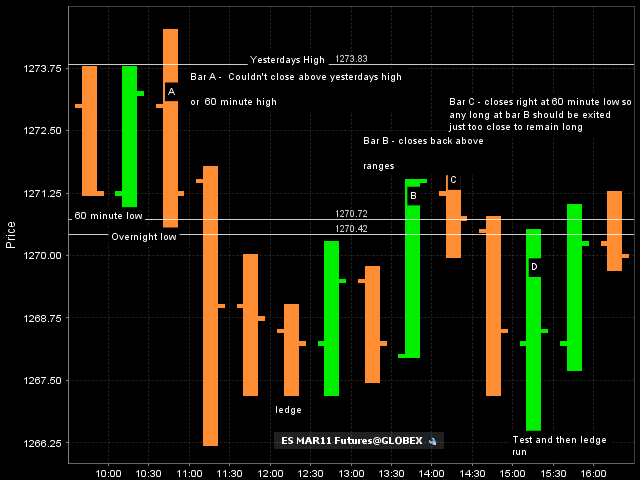
anytime and thanks for your posts too!! Lets see if this employment report can do anything to bring some volatility back to the market in the morning....seems like we are on our way to having one of those Doji- thing- a- mabob weeks...perhaps closing near 63 on friday..but I'm not a good predictor
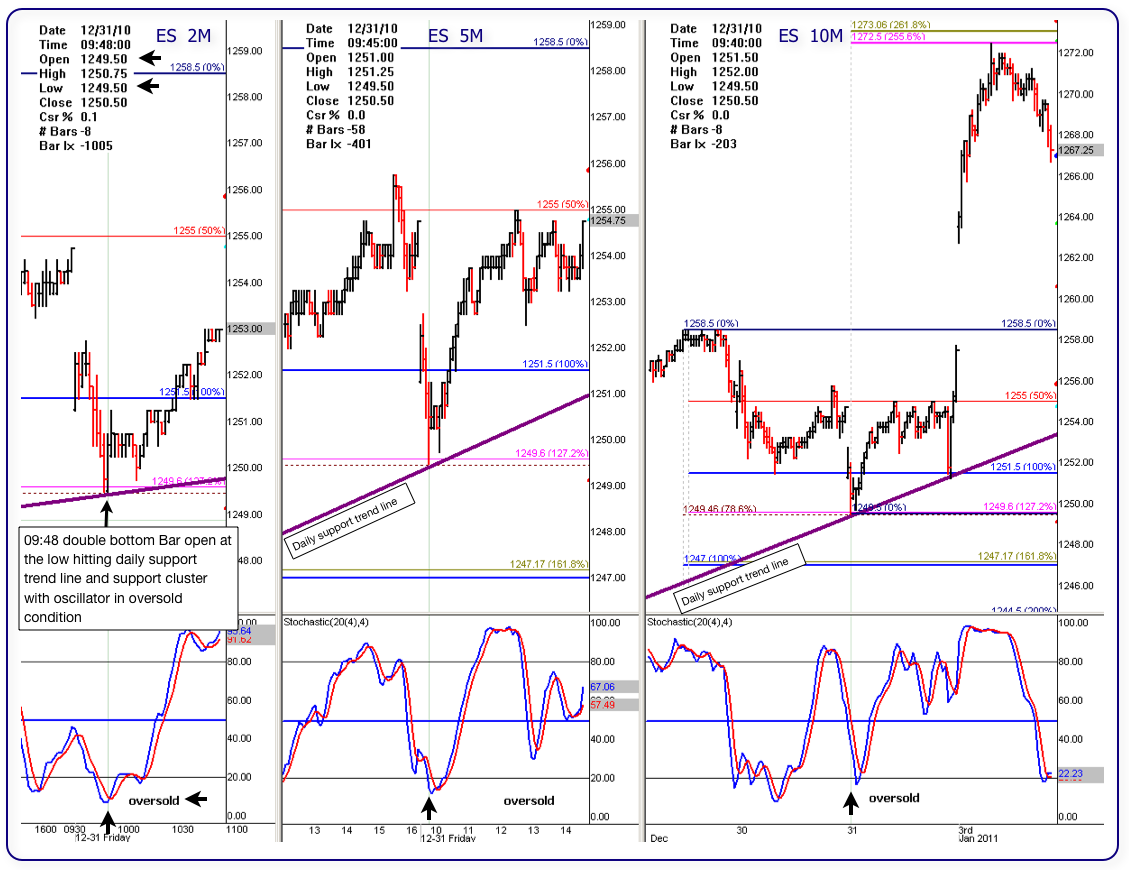
Here is one example of double bottom, "BUT" it is in a 2M chart.
Below is a pic of 3 intraday charts from the same day session 12/31/10. A 2M chart (left), a 5M and a 10M.
In the 2M chart, notice that at 09:46, the price hits the daily support trend line and percentage support cluster (78.6% and 127.2%) then bounces off. The second 2m bar, at 09:48 opens right at support and also bounces off creating a double bottom with the opening right at the low on support.
Notice that the other time frame isolators where working their way down to oversold.
This set-up does not happen often but when it does it is fun to trade it.
Click image for original size
Emini Day Trading /
Daily Notes /
Forecast /
Economic Events /
Search /
Terms and Conditions /
Disclaimer /
Books /
Online Books /
Site Map /
Contact /
Privacy Policy /
Links /
About /
Day Trading Forum /
Investment Calculators /
Pivot Point Calculator /
Market Profile Generator /
Fibonacci Calculator /
Mailing List /
Advertise Here /
Articles /
Financial Terms /
Brokers /
Software /
Holidays /
Stock Split Calendar /
Mortgage Calculator /
Donate
Copyright © 2004-2023, MyPivots. All rights reserved.
Copyright © 2004-2023, MyPivots. All rights reserved.