RO
roofer
Rep: 3,689
Posts: 3,574
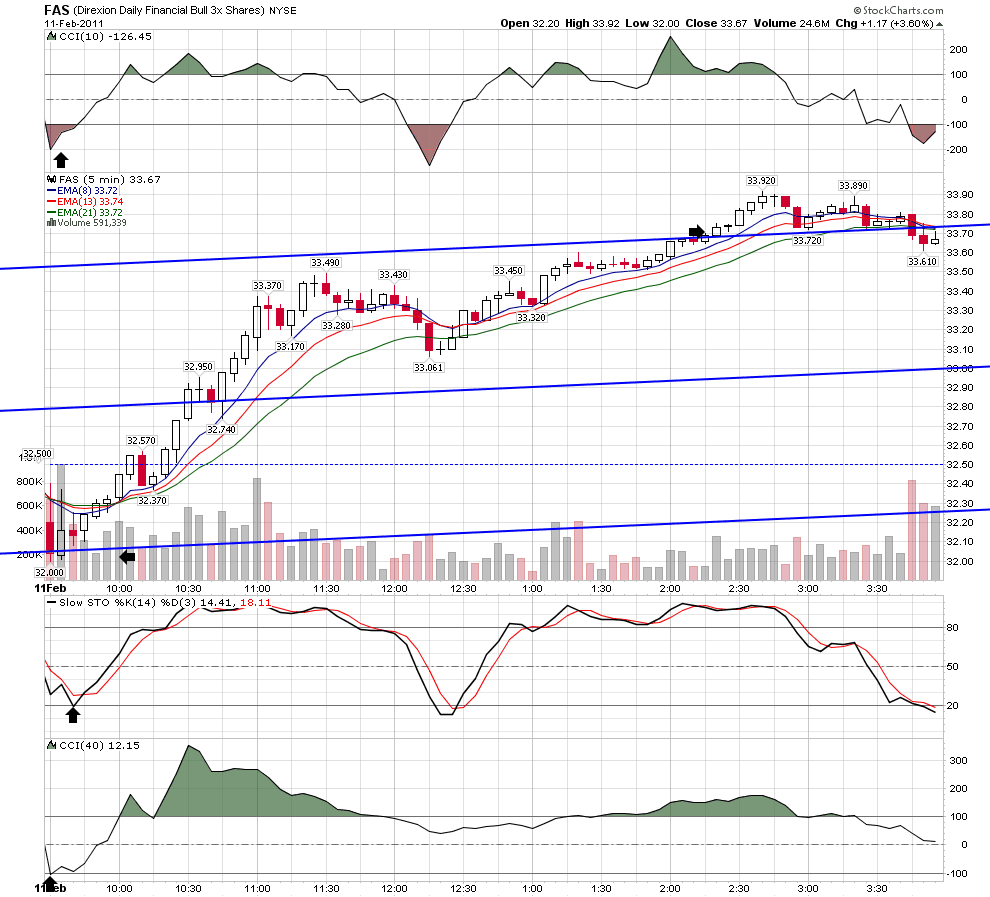
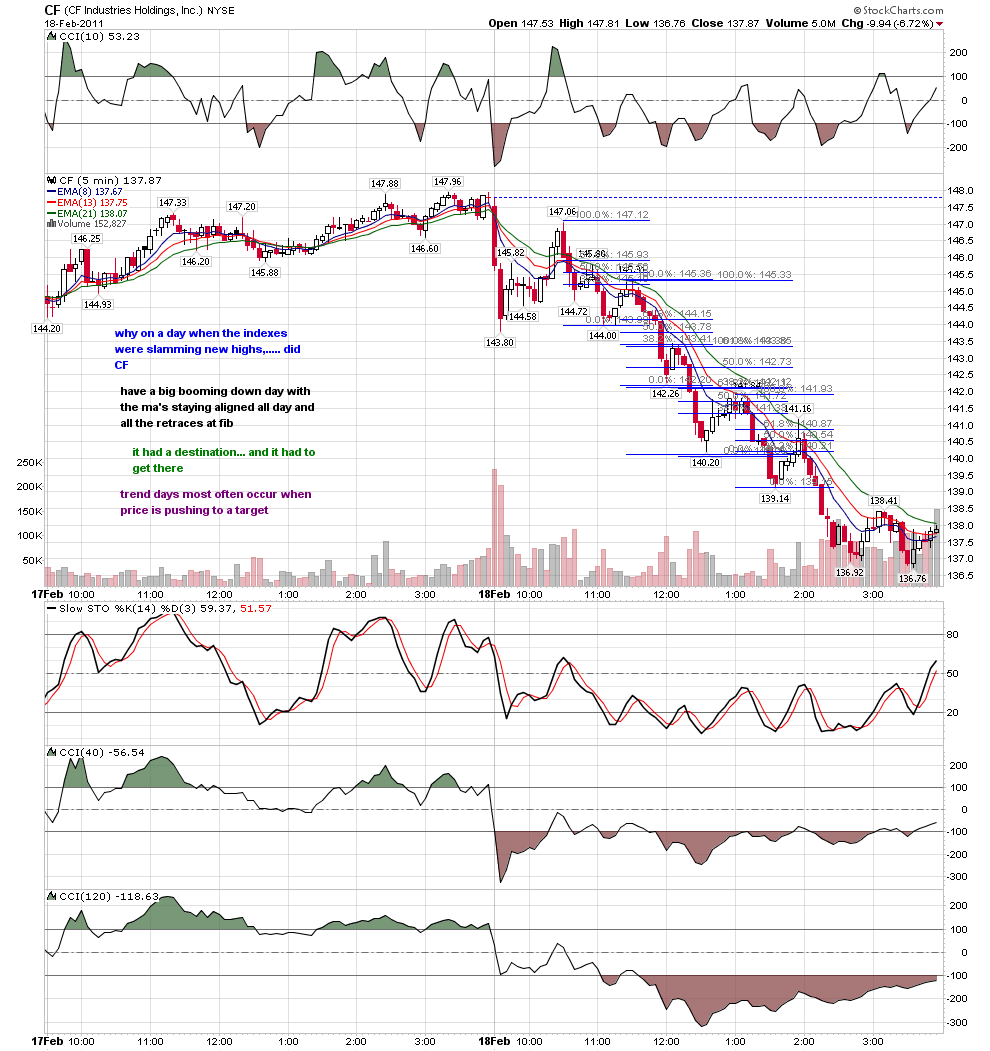
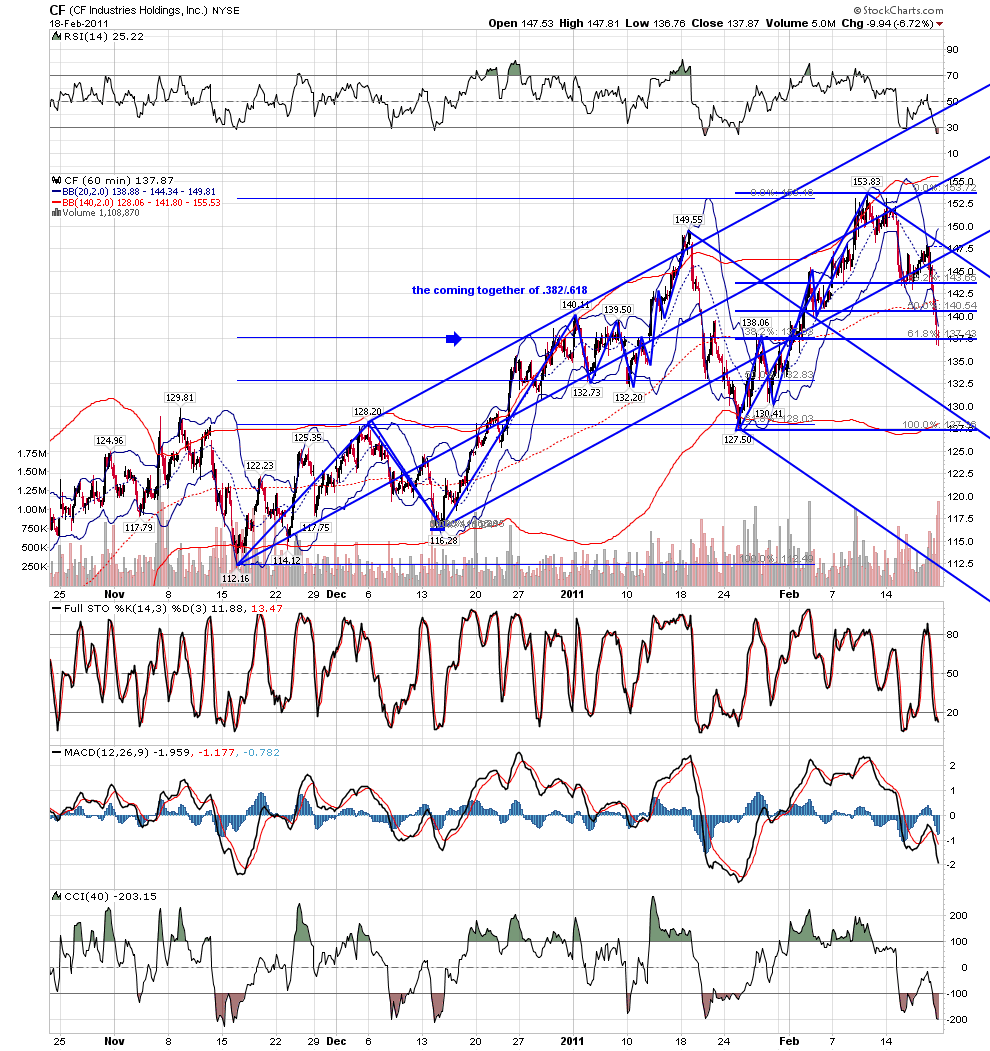
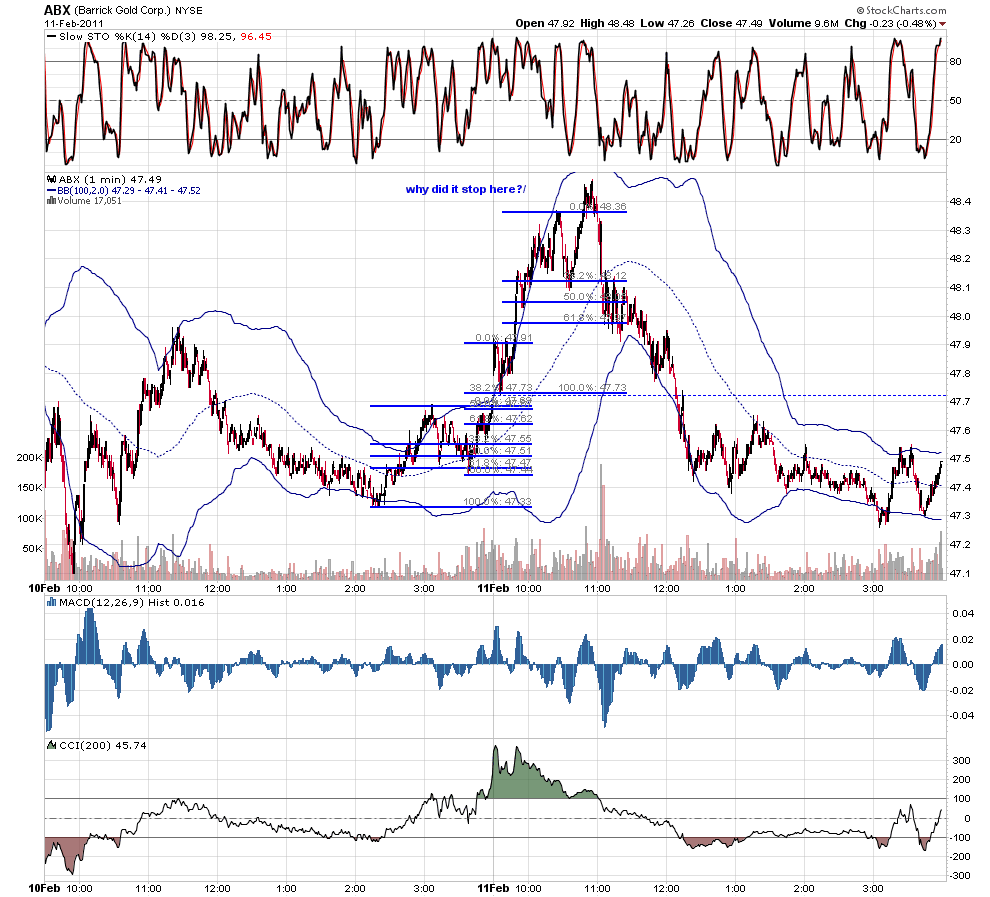
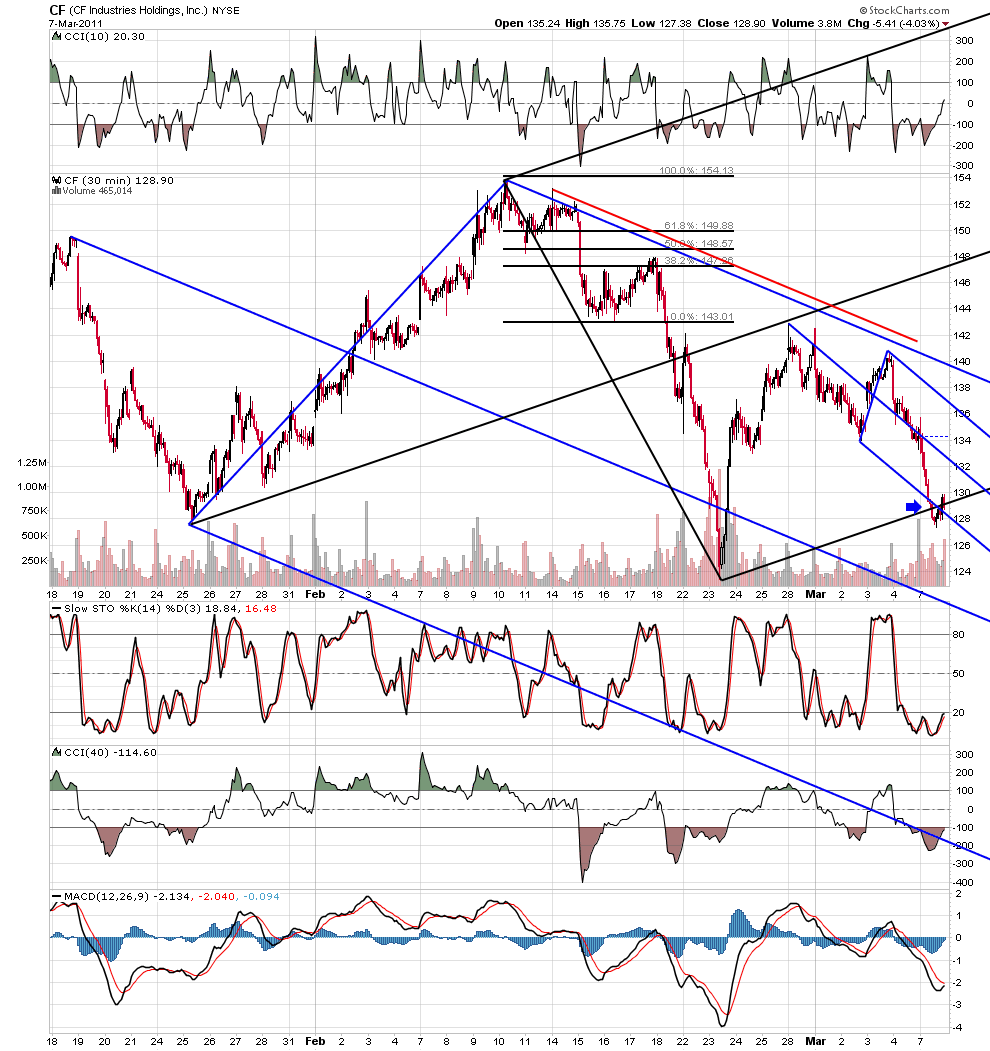
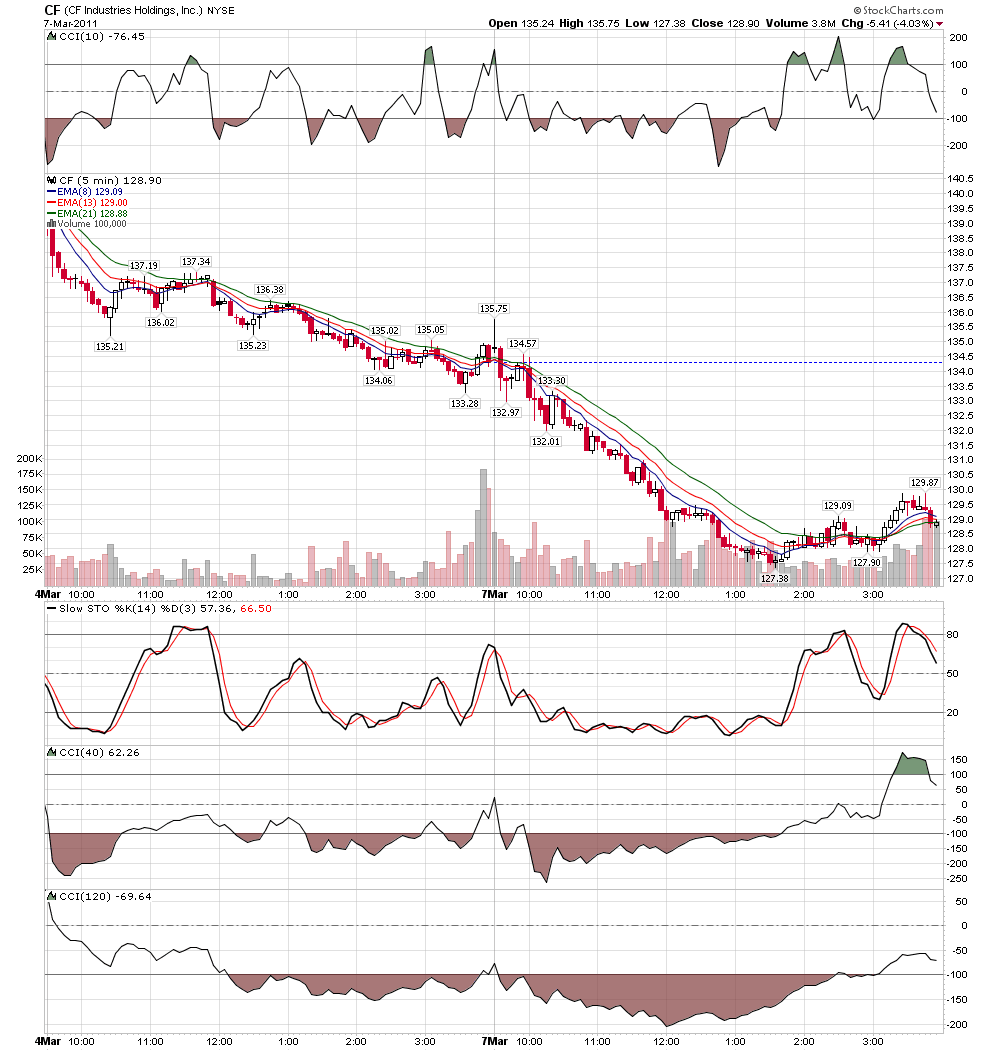
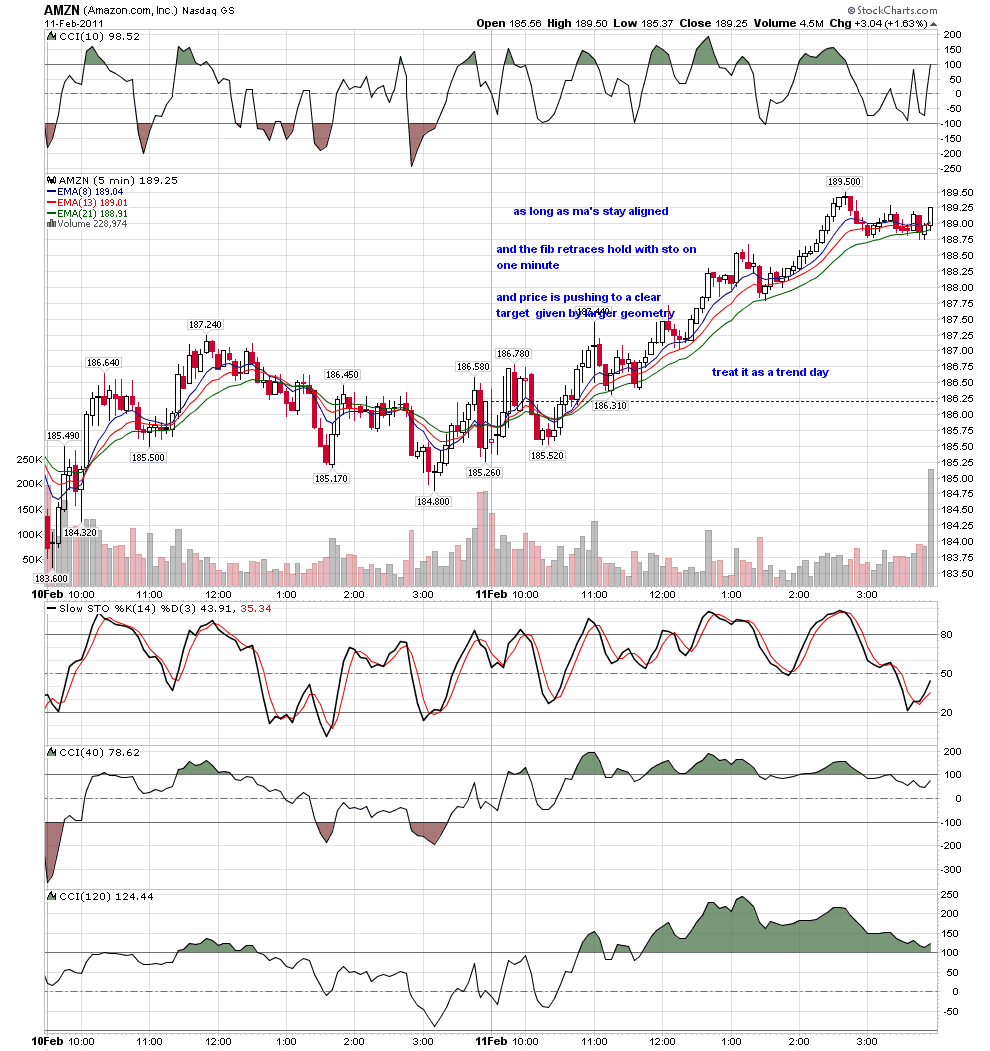
i have added to my posts in the public section CHARTS on trend days... it is my contention that trend days occur when price is gunning for a target......you may have noticed a new stock on my screen TSO..... has had a massive run up with no consolidations with back to back to back trend days.... it is in extreme hurry to get to a specific target given by the geometry.... the mad short seller is looking to whack it there......you should be able to find it...
TX
tx_ches
Rep: -10
Posts: 514
Thanks for pointing us to those posts. I've saved off the charts so I can study and practice on those trend days once I finish all the Kane books. I've tried practicing on some of the charts from the early Kane books and some of those symbols/companies from the 2001 era don't exist anymore. lol.
RA
rat89
Rep: 0
Posts: 7,015
Sorry I'm so dense.....I found that area once, but can't seem to find it now....
TX
tx_ches
Rep: -10
Posts: 514
In the public forum section (click forum tab at top), click on Charts.
Then click on topic Recognizing trend days.
Roofer's charts are on the 2nd page.
Then click on topic Recognizing trend days.
Roofer's charts are on the 2nd page.
TX
tx_ches
Rep: -10
Posts: 514
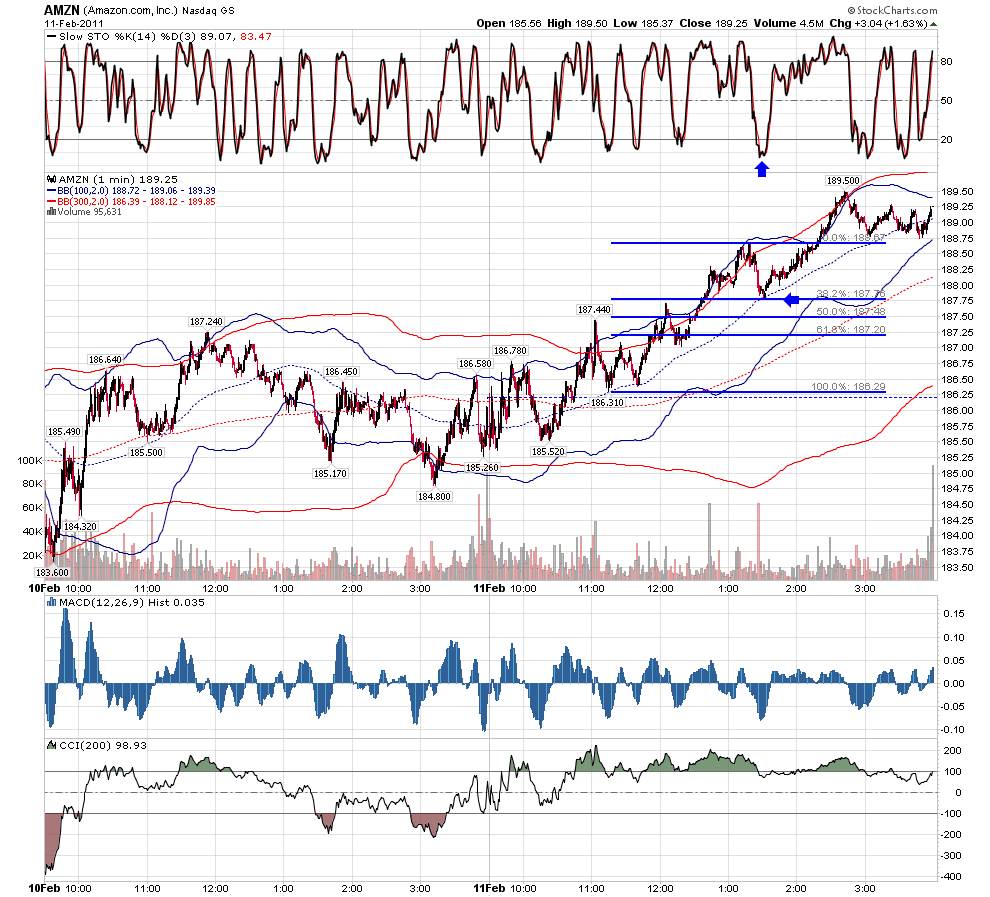
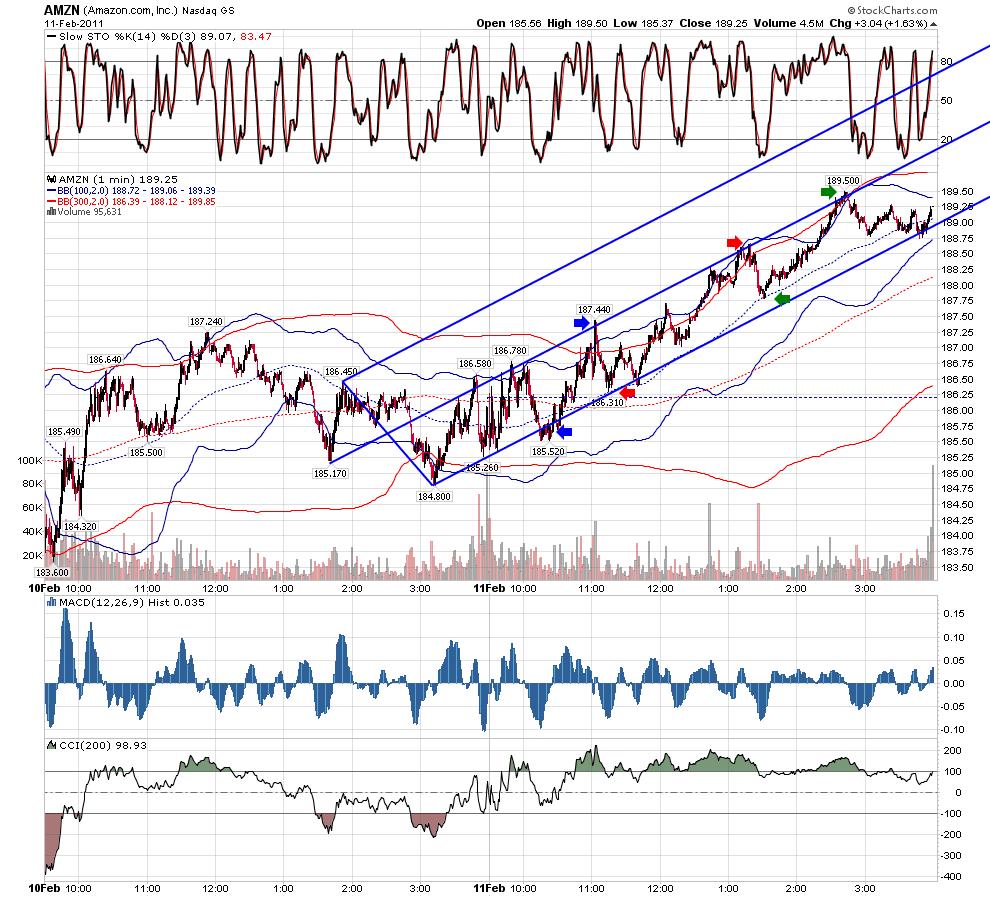
Roofer's AMZN charts from public section.
Click image for original size
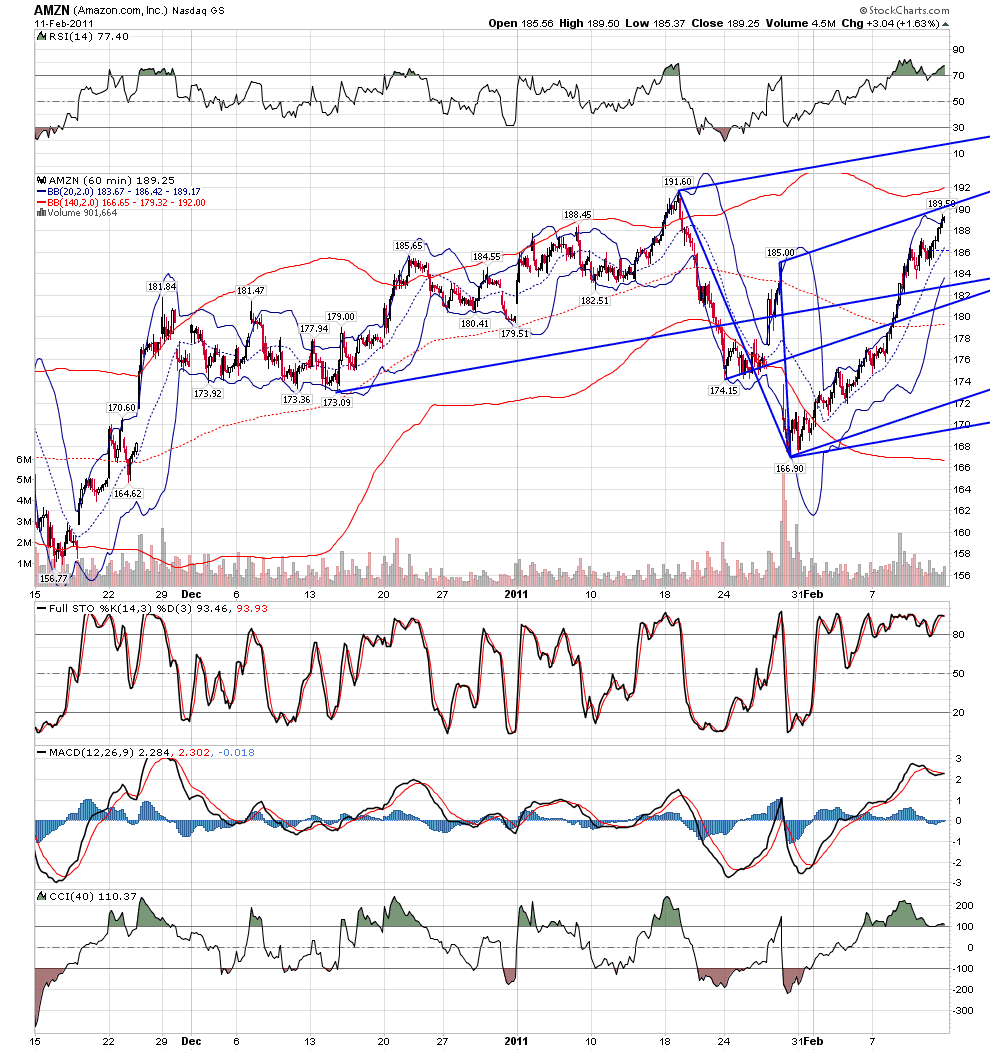
Click image for original size
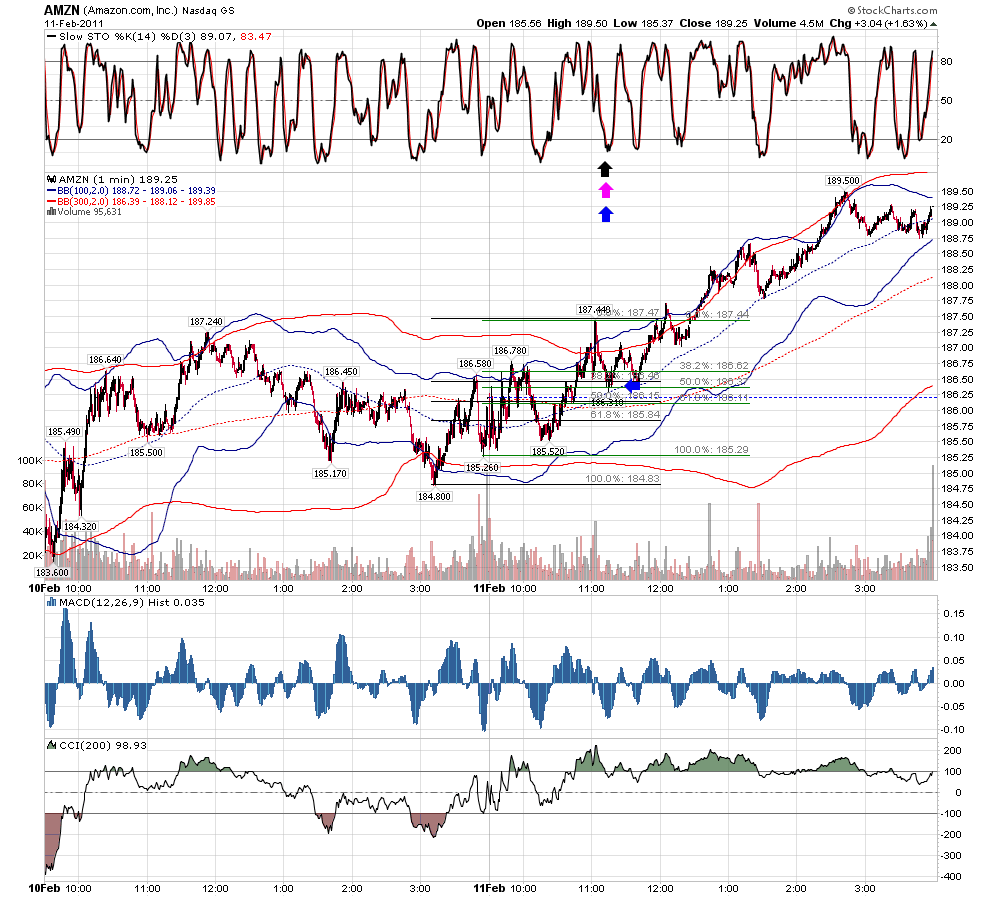
Click image for original size
Click image for original size
Click image for original size
TX
tx_ches
Rep: -10
Posts: 514
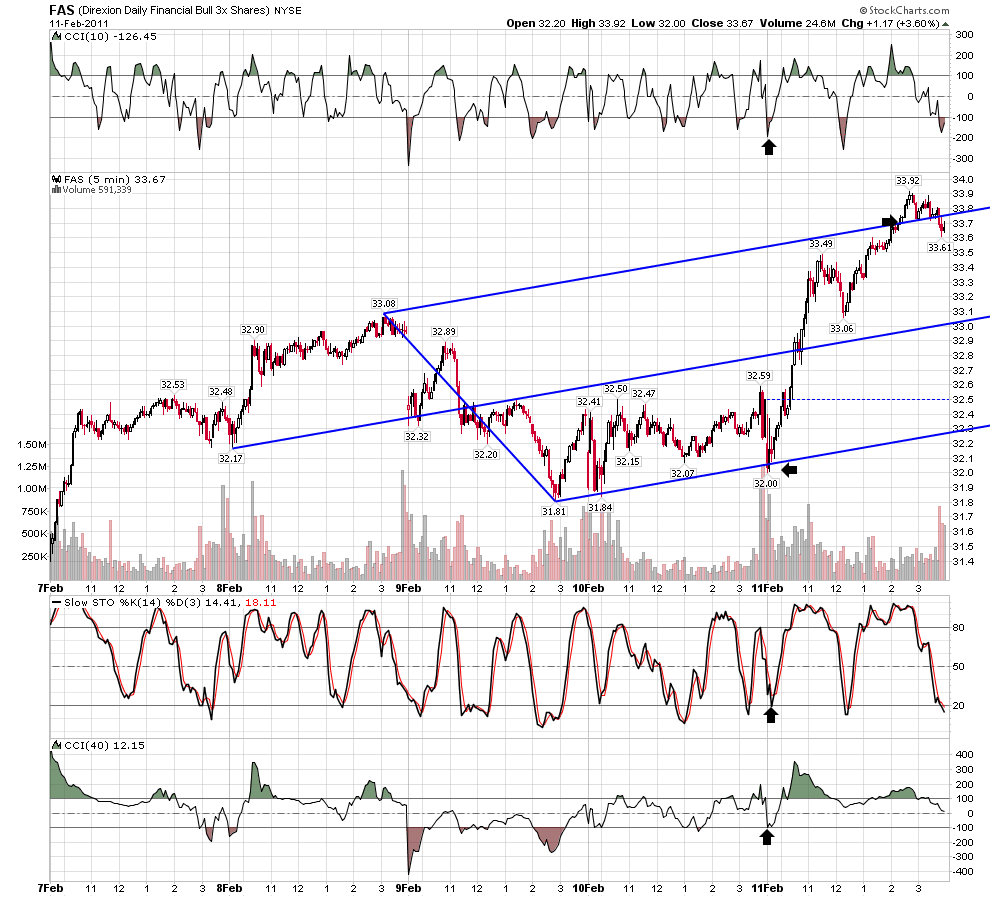
Roofer's two fas charts from public section.
Click image for original size
Click image for original size