RO
roofer
Rep: 3,689
Posts: 3,574
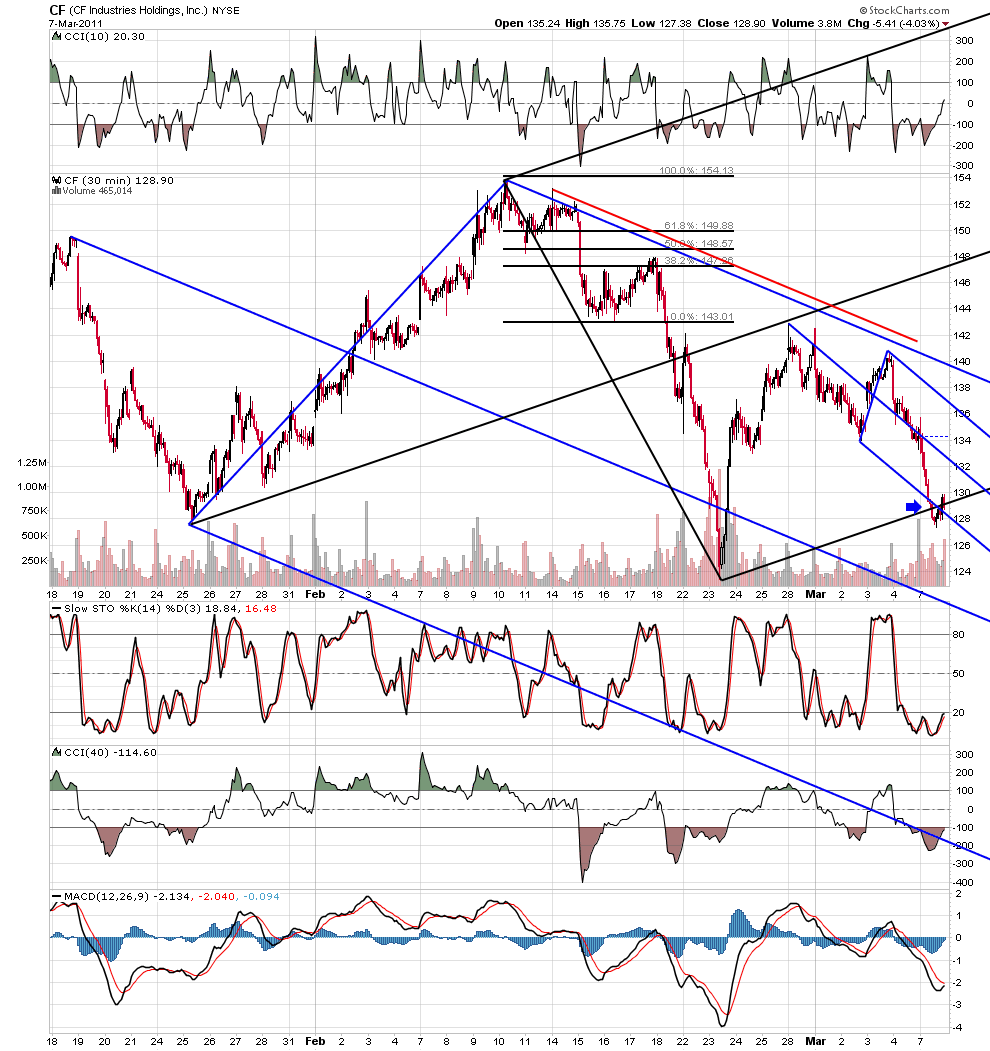
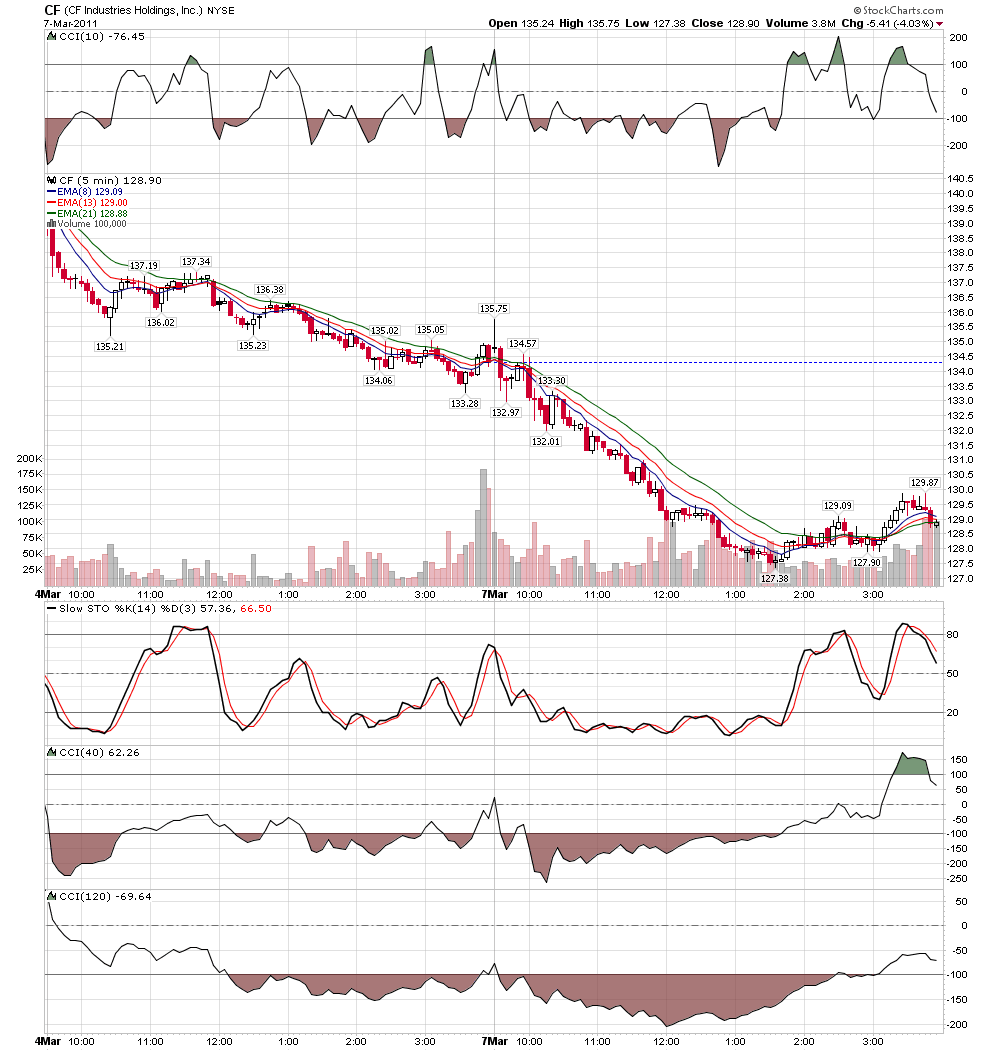
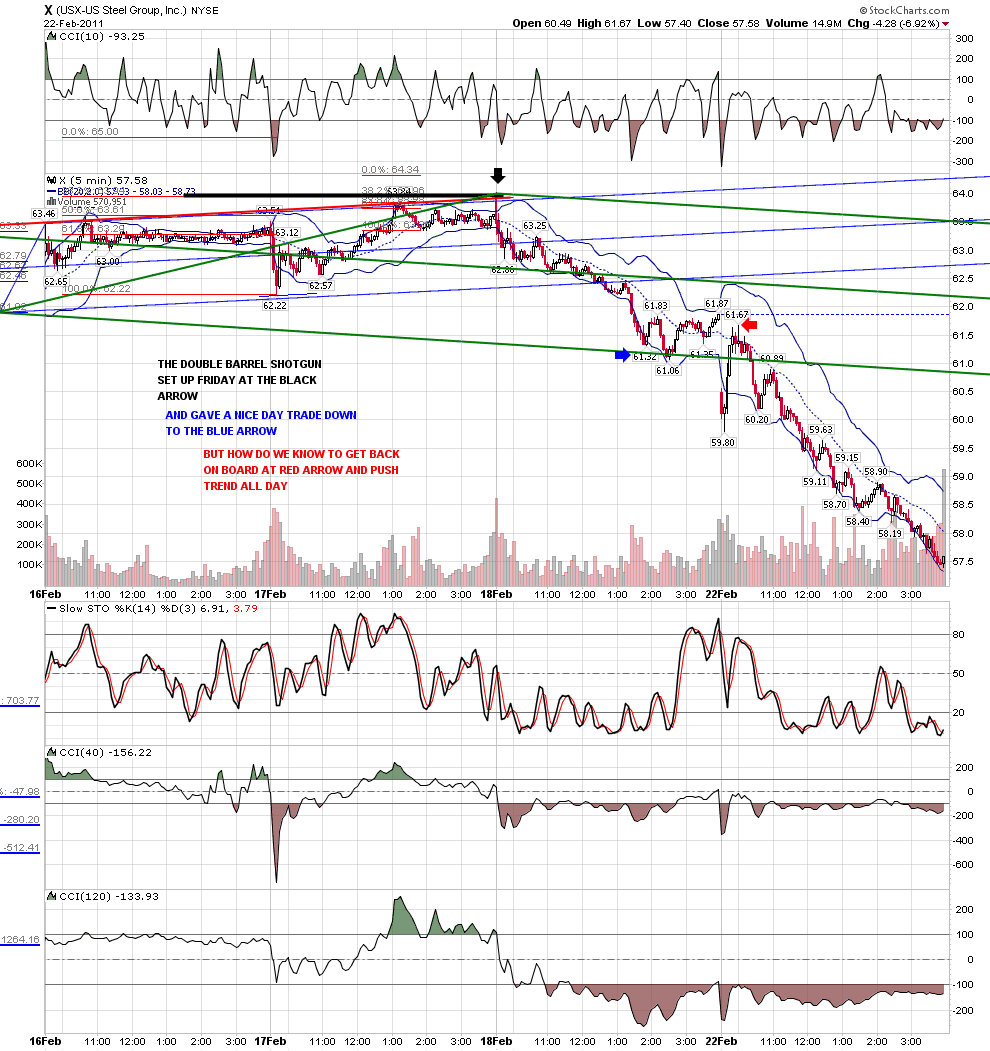
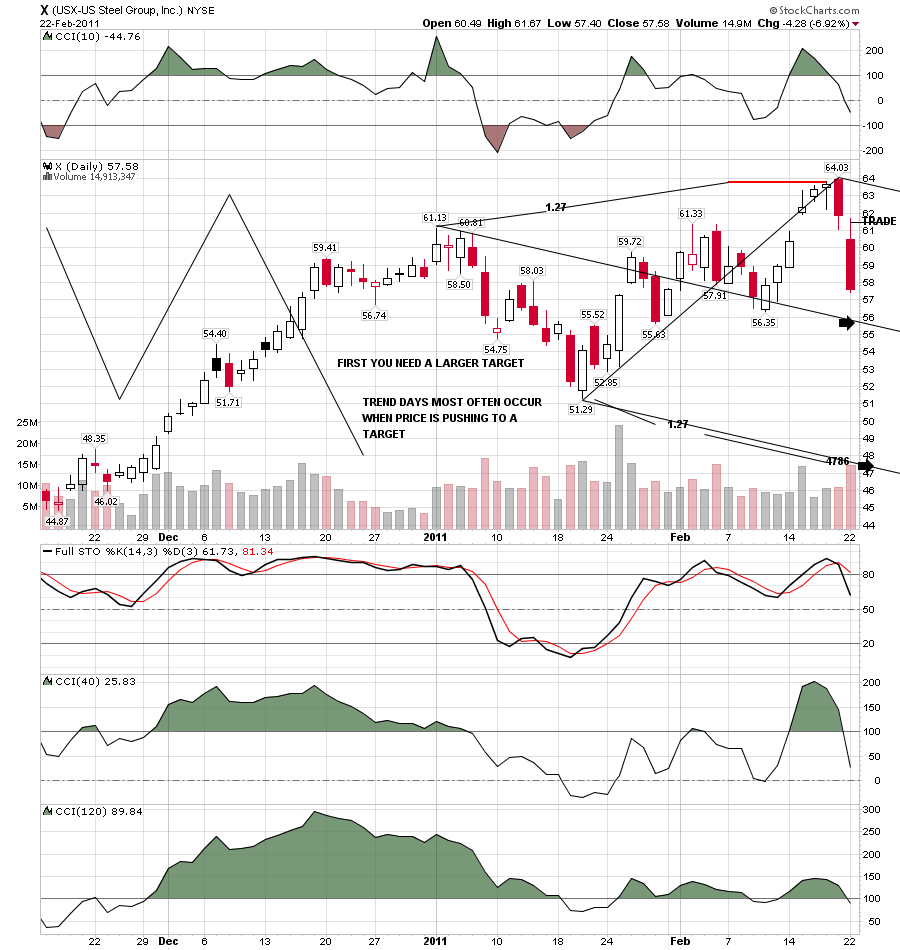
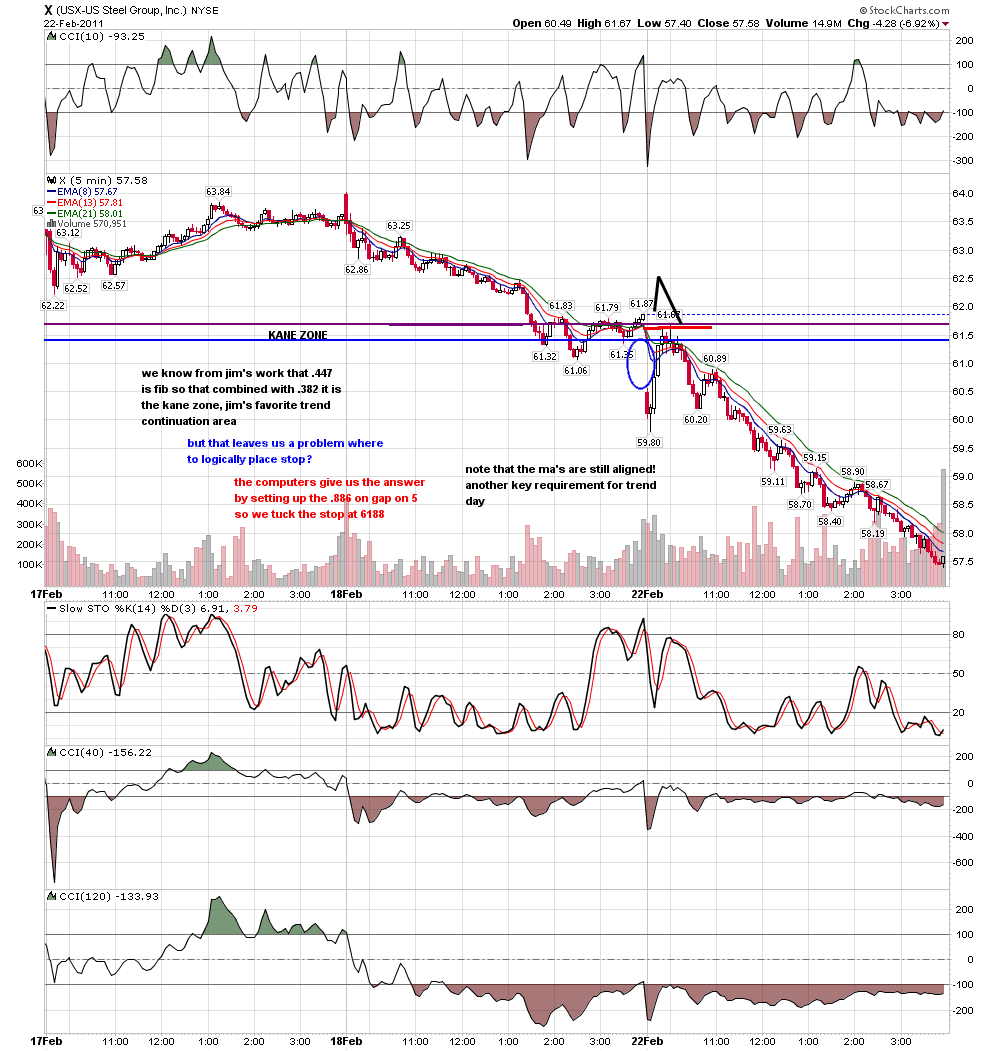
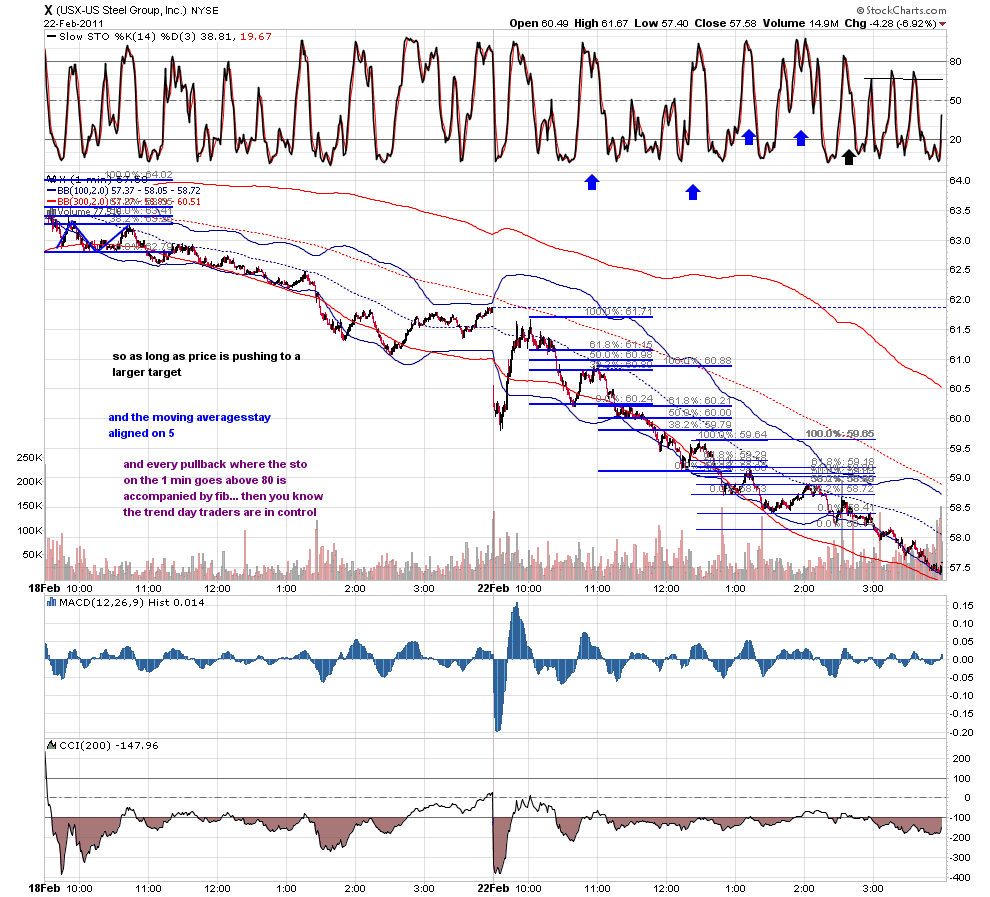
i have added to my posts in the public section CHARTS on trend days... it is my contention that trend days occur when price is gunning for a target......you may have noticed a new stock on my screen TSO..... has had a massive run up with no consolidations with back to back to back trend days.... it is in extreme hurry to get to a specific target given by the geometry.... the mad short seller is looking to whack it there......you should be able to find it...
RO
roofer
Rep: 3,689
Posts: 3,574
Click image for original size
Click image for original size
Click image for original size
Click image for original size
JI
jimkane
Rep: 3,058
Posts: 33,089
That's a great post, roofer. As soon as you start talking trend, you are talking my game, so I love the way you are looking at this example. Just like I can look at line to line (albeit on a lower timeframe as a trend from point A to point B), you can 'talk trend' quite well. It's all about finding what tools you want to use, and how you want to use them, unique to your own 'Trading Plan'. roofer and I stress this endlessly.
RO
roofer
Rep: 3,689
Posts: 3,574
yep... it's just like fishing.. first you want to catch a fish(make money) then catch alot of fish( alot of money) then you want to catch the big fish( have the homerun trade) then you want to catch the fish the way you want to( by being a mad short seller in a raging bull)