MyPivots
Sign In
RO
roofer
Rep: 3,689
Posts: 3,574
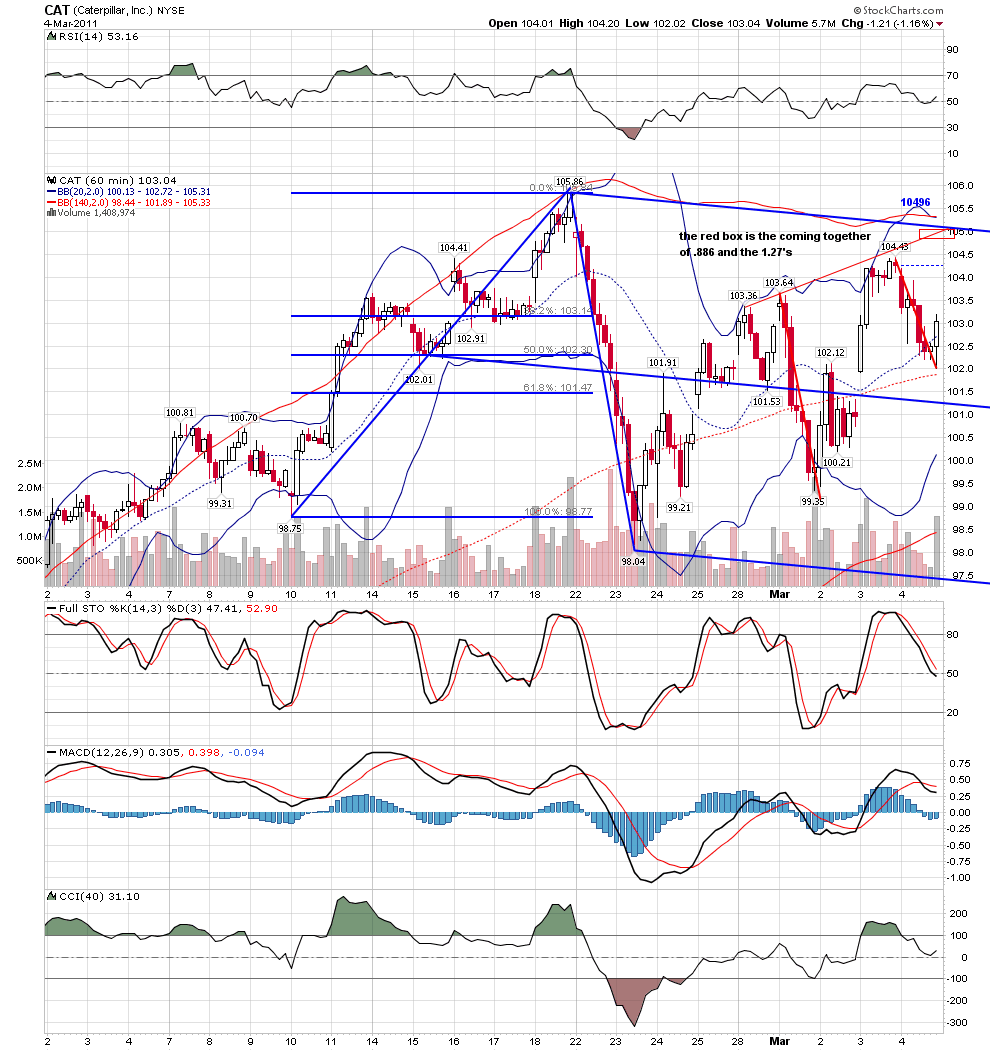
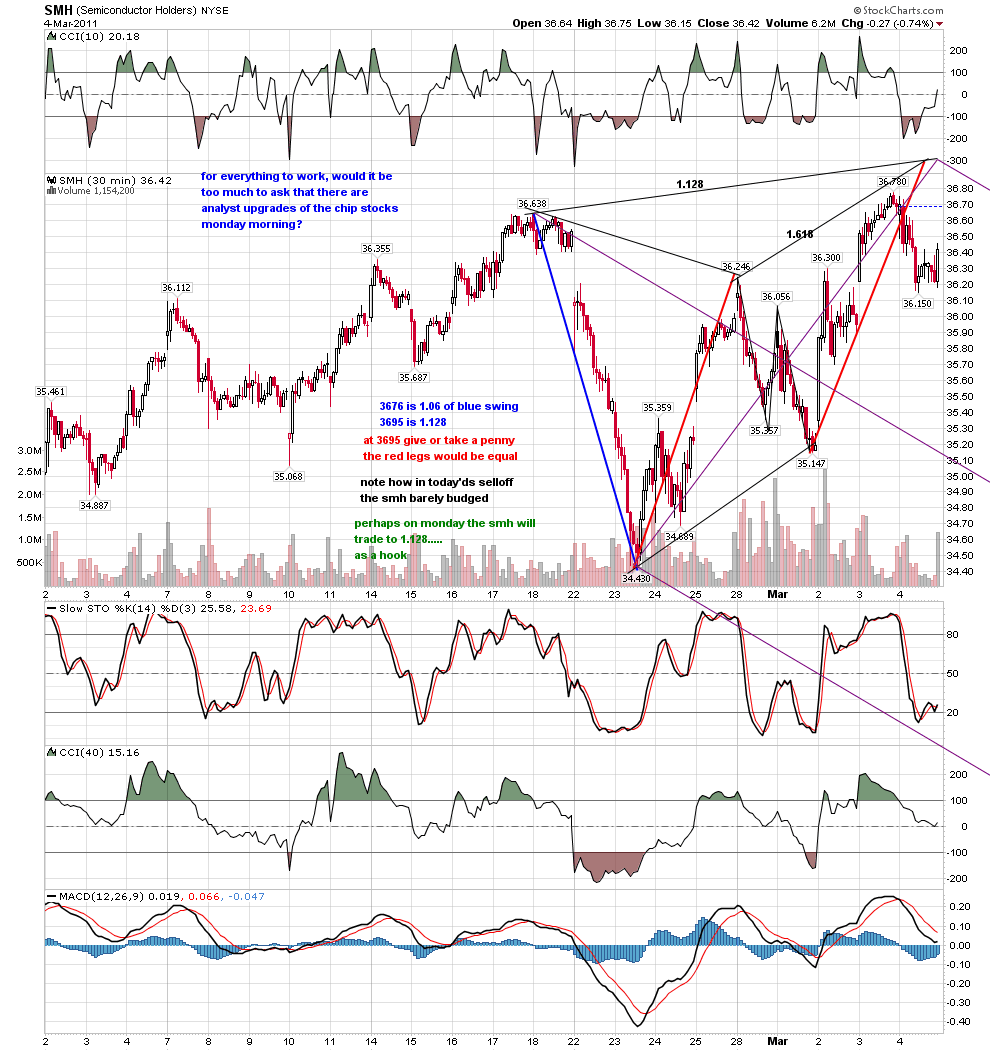
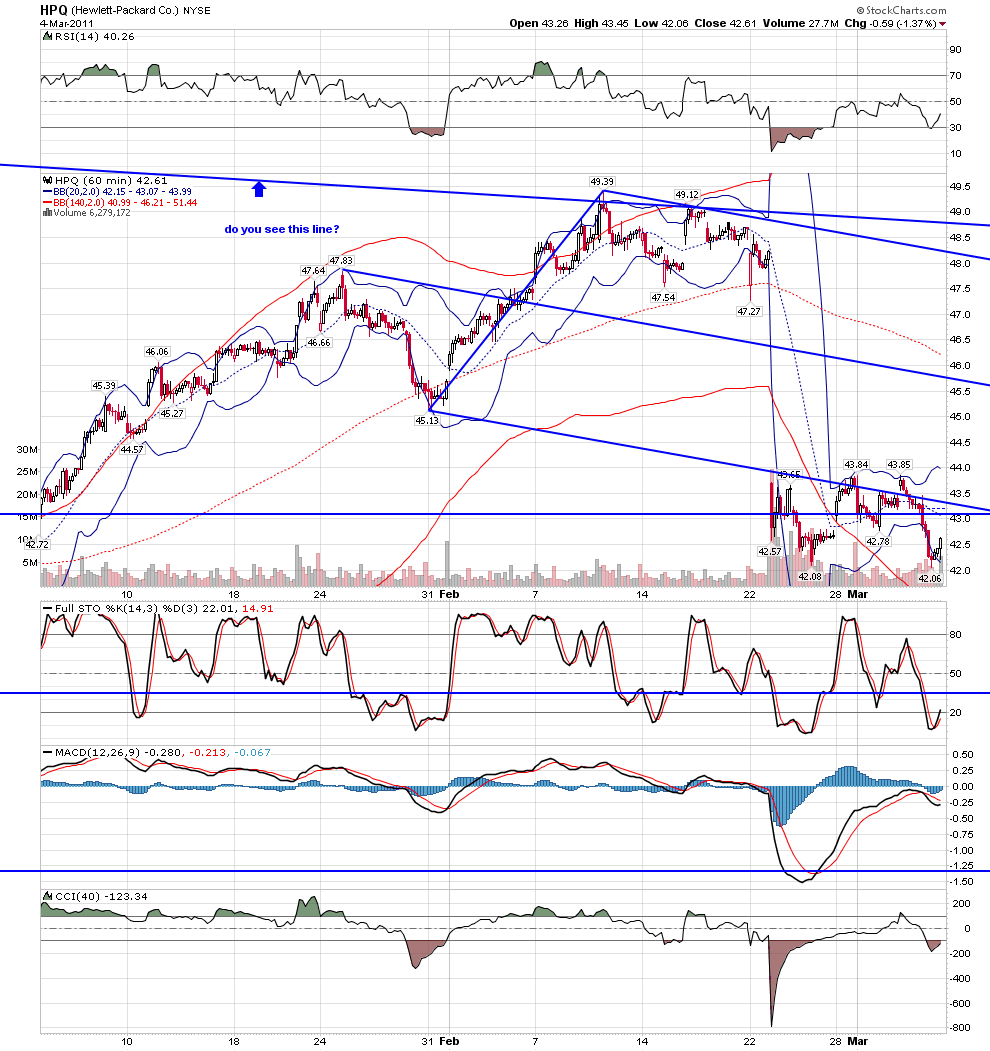
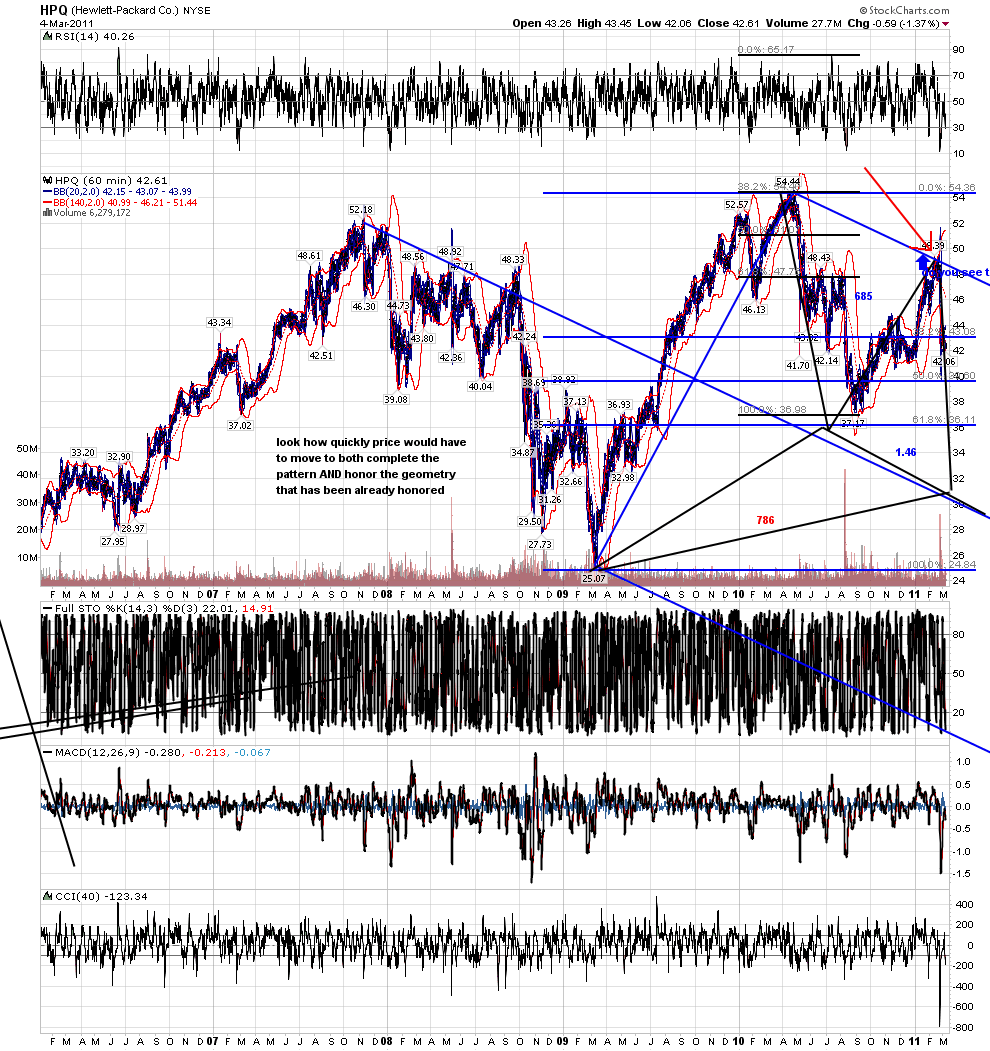
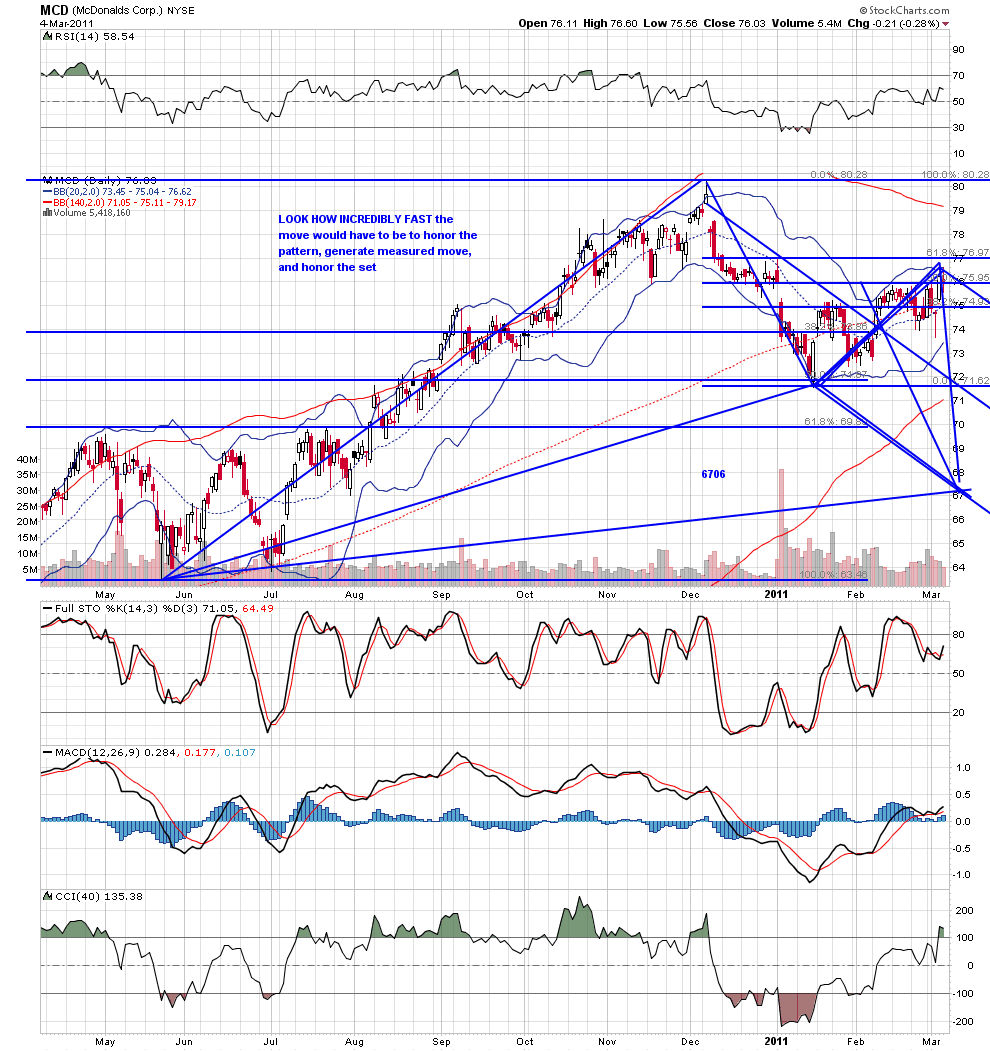
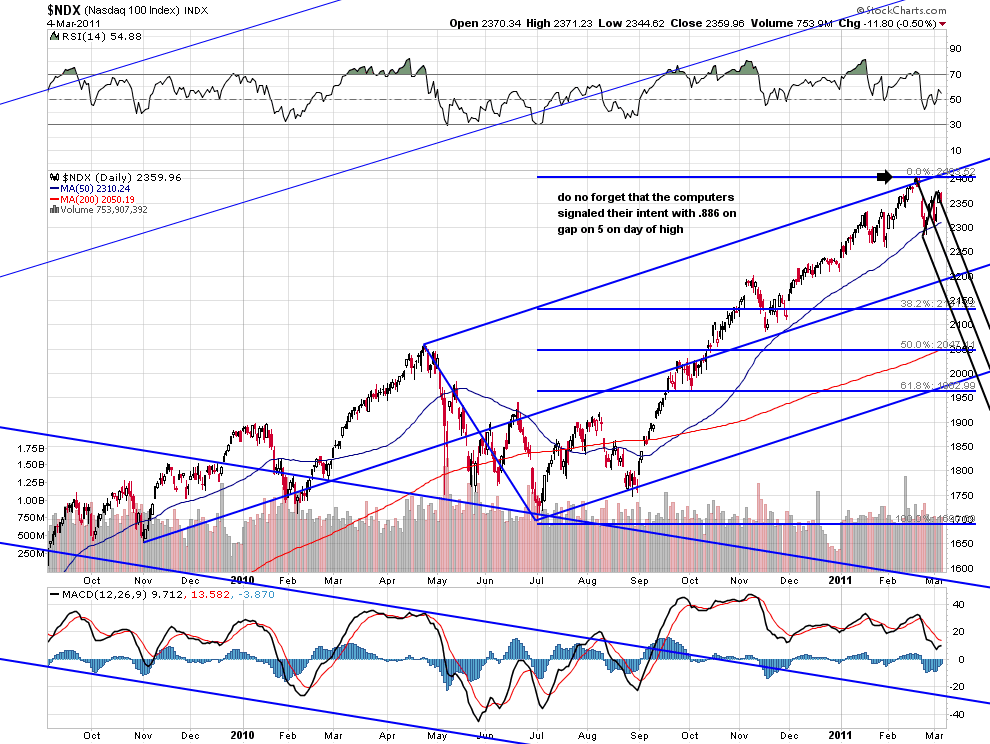
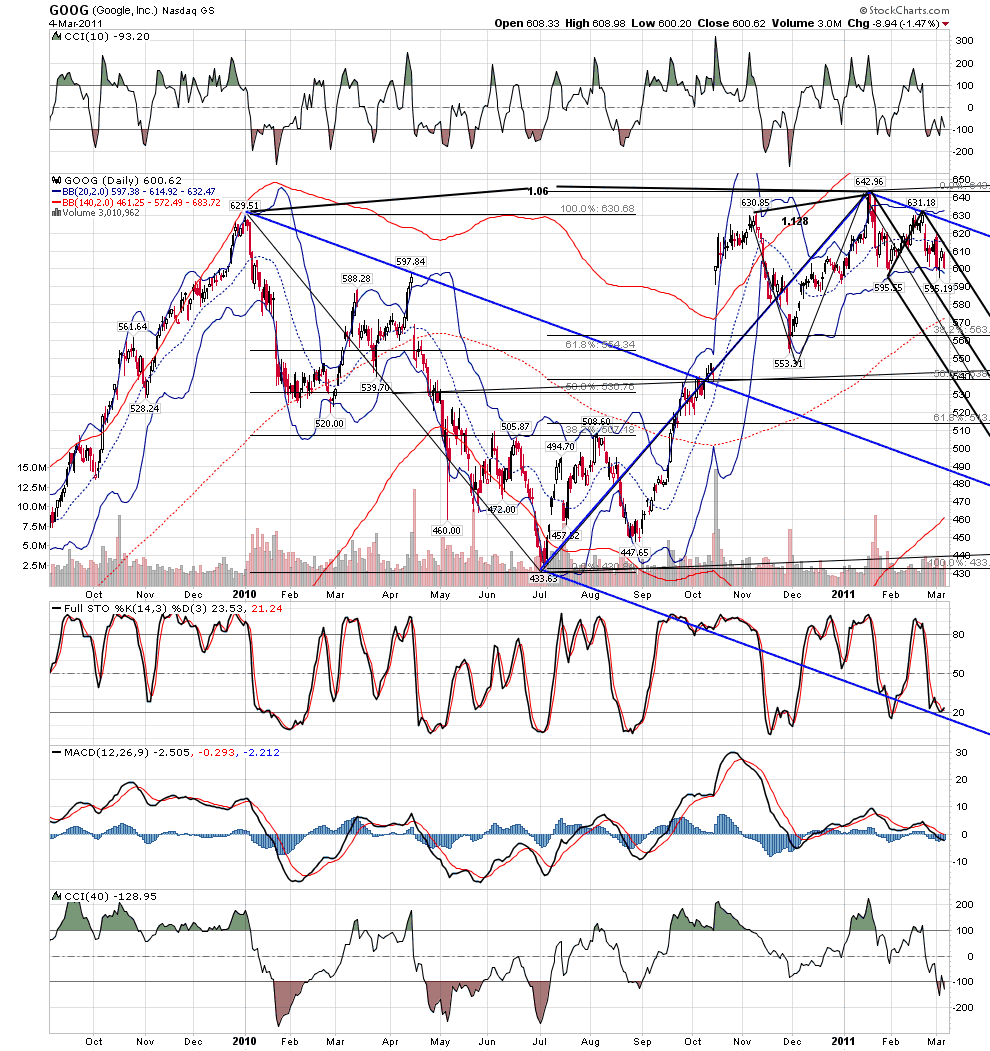
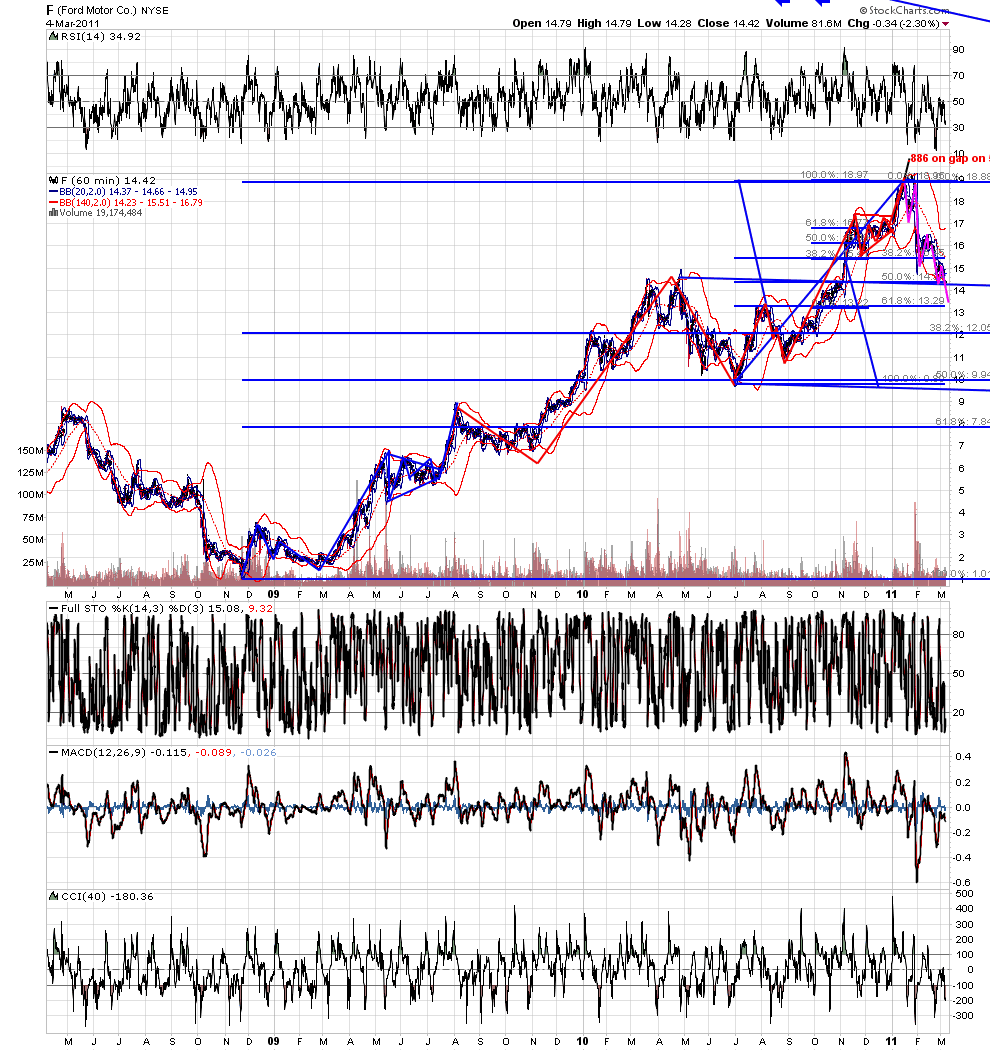
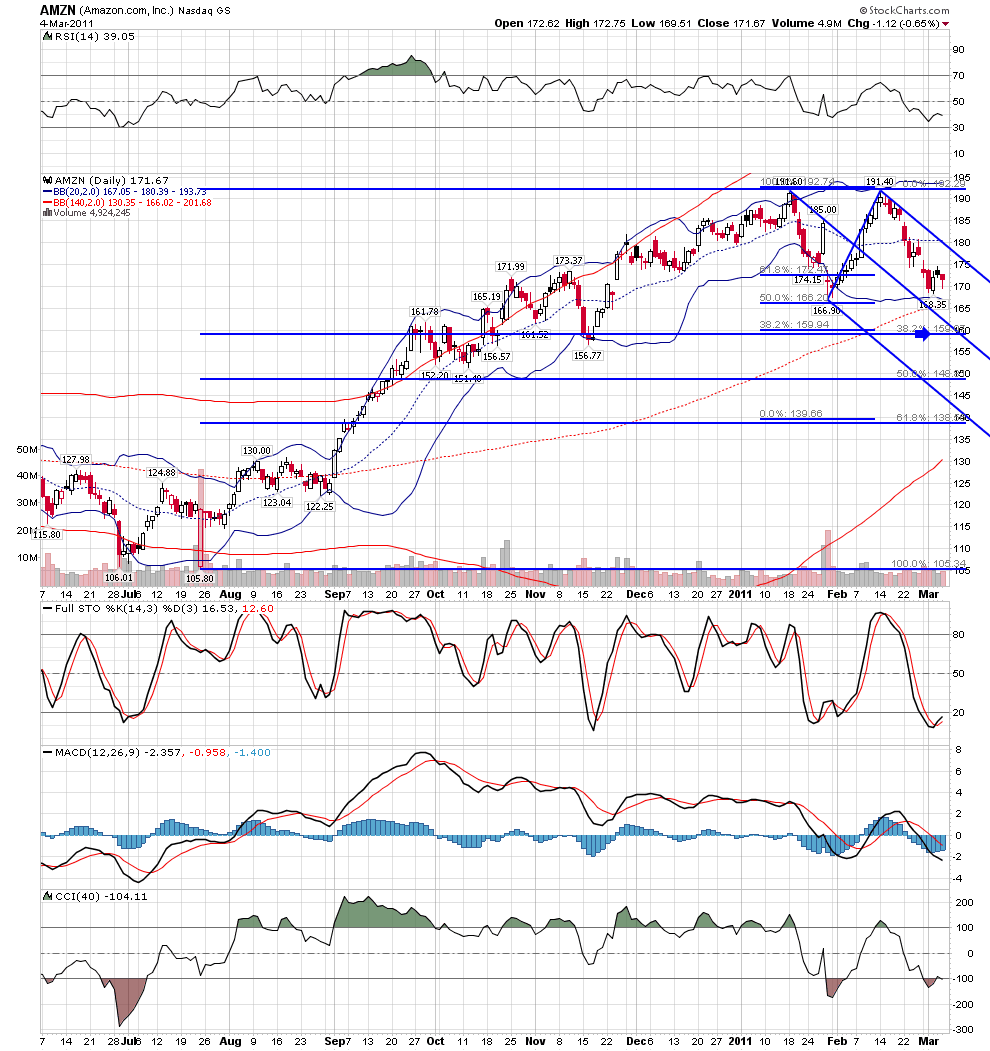
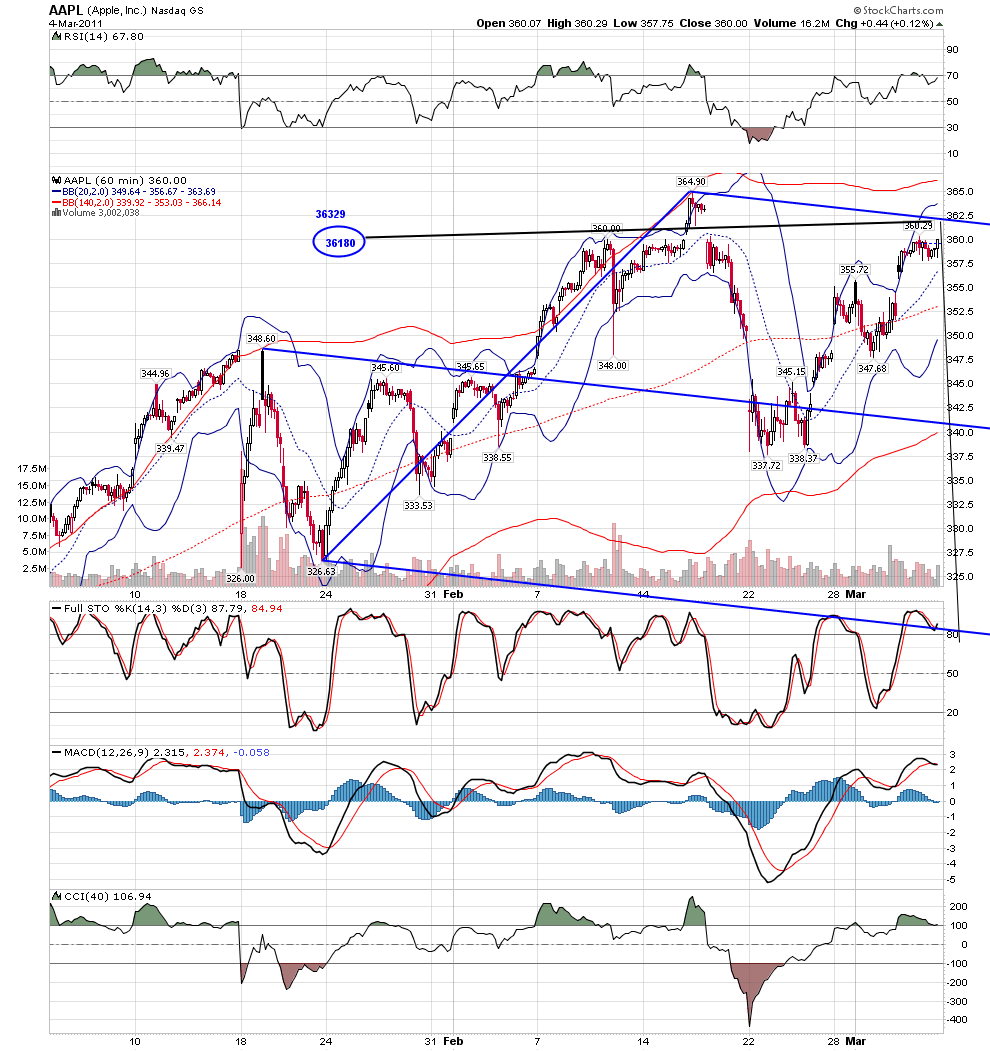
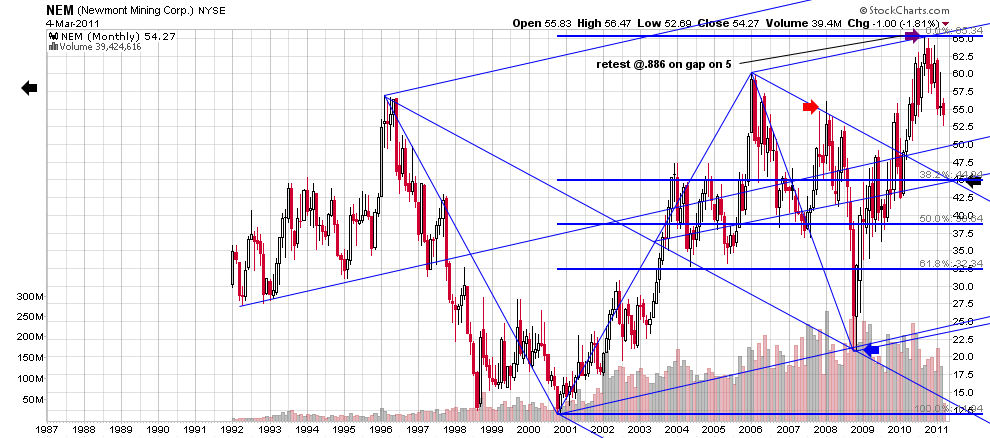
i appreciate deeply jim taking the time to post the links to how the oligarchs control our country and our markets.but the winds of change are about the land and people are actually thinking we need some change..... that is not a good thing for the oligarchs.... they are always a step or two ahead....how will they maintain their control? by orchestrating a crash and thus eliminating any chance that the qe's will not go on forever... i am only seeing this because it is in the geometry we trade... i keep track of stocks that have topped at .886 on gap on 5... using the geometry we trade i see downside targets to be met. way down ..with the time element. given by medianline sets saying now.. but the market has been held up by the oligarchs while they create massive short positions for their accounts...they are masters at deception.... the key is THE BIG DOG.... the most over owned overloved stock... they have held it up at all costs.. how could anything be wrong if AAPL sits just points from a new high.... but kane traders know...if on monday they open AAPL at .886 on gap on 5 at the geometry and then it turns down, i believe we are looking at a crash... if not... then perhaps i have just stayed up too late tonite... i have enclosed some charts... see the setup in AAPL...see the forcast i made months ago here that NEM needed to trade down despite the rise in gold... see how that trade must go now....see the classic blow up in F at .886 on gap on 5.. monday will tell the tale...
Click image for original size
Click image for original size
Click image for original size
Click image for original size
Click image for original size
Click image for original size
RO
roofer
Rep: 3,689
Posts: 3,574
Click image for original size

Click image for original size
RO
roofer
Rep: 3,689
Posts: 3,574
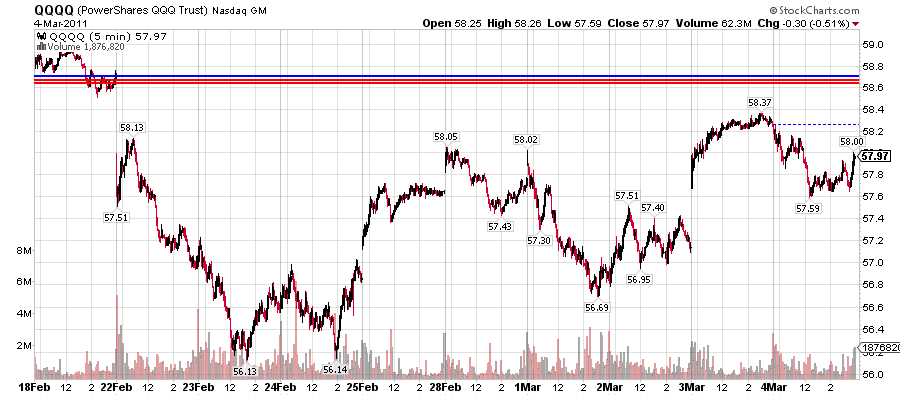
the pit bull has ALREADY signaled its intent.... we are just waiting for the BIG DOG

Click image for original size
RO
roofer
Rep: 3,689
Posts: 3,574
Click image for original size
RO
roofer
Rep: 3,689
Posts: 3,574
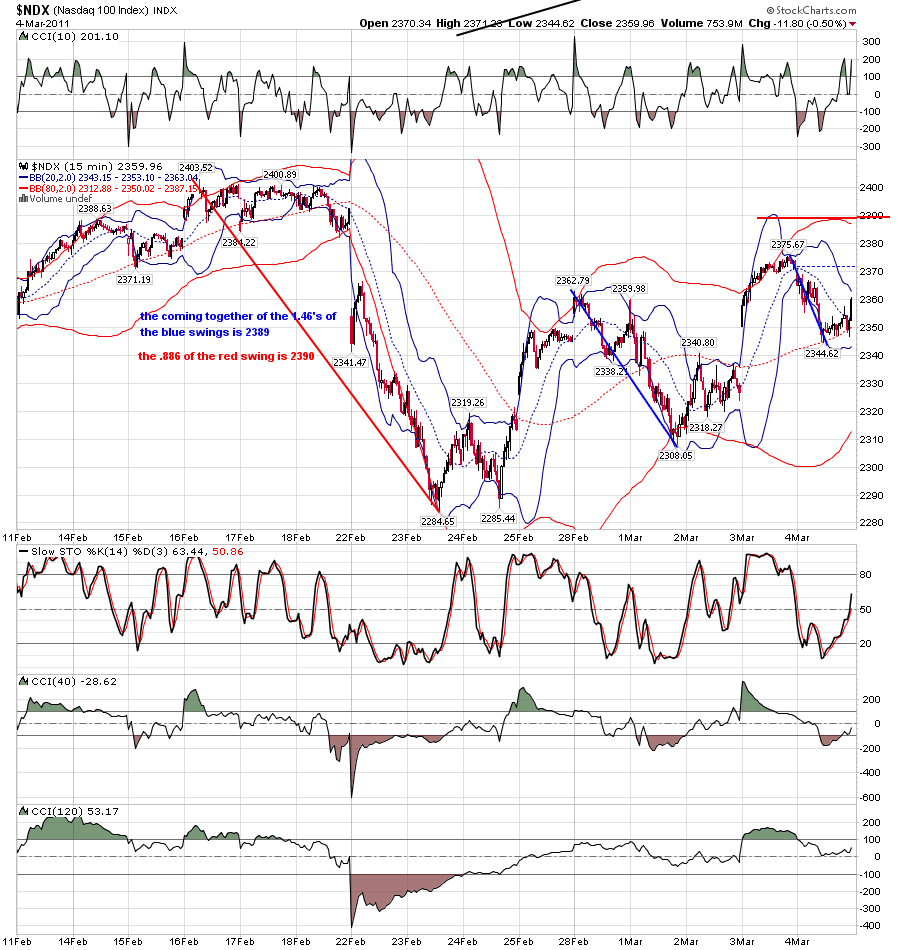
ndx
Click image for original size
RO
roofer
Rep: 3,689
Posts: 3,574
this is why i have urged others to pay the bucks... join the forum....... if you did not know 1.46 was fib, you would not see this clearly....
Click image for original size
RA
rat89
Rep: 0
Posts: 7,015
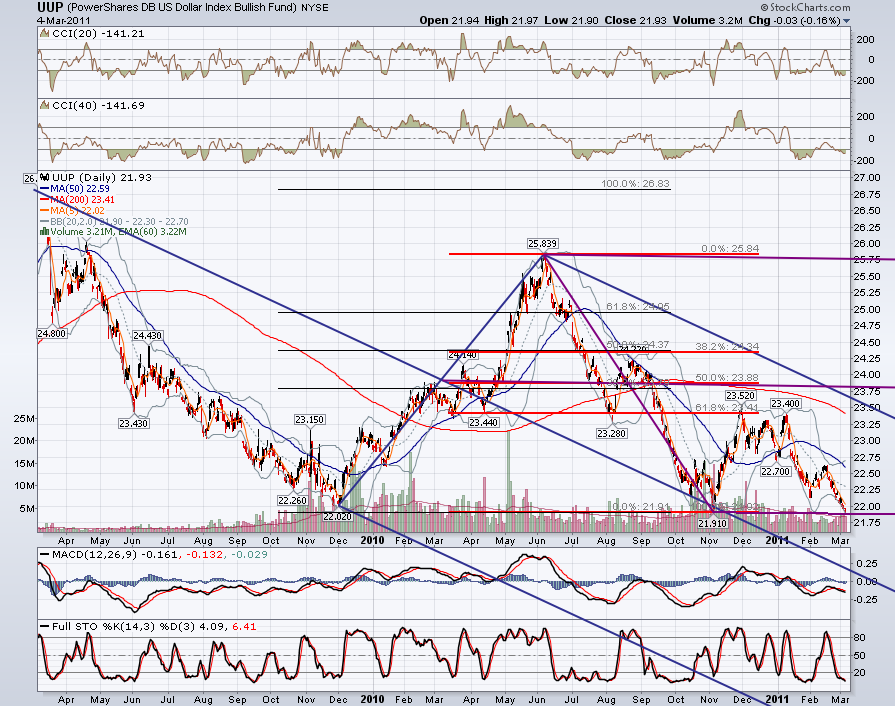
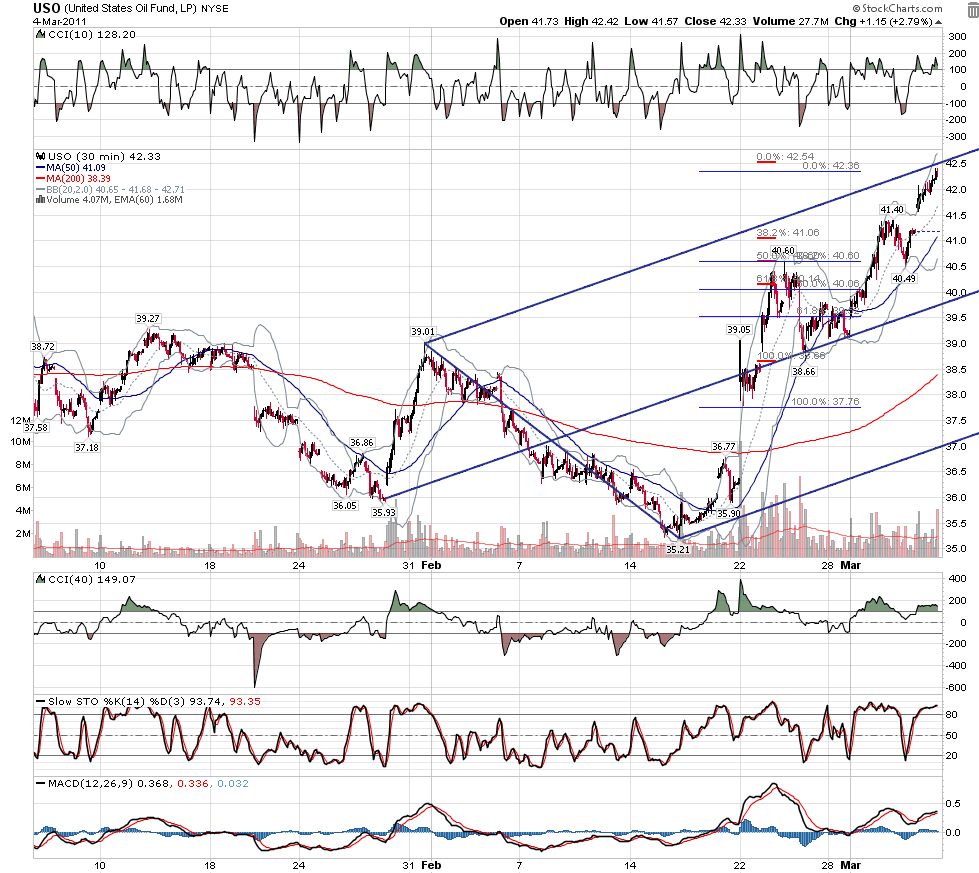
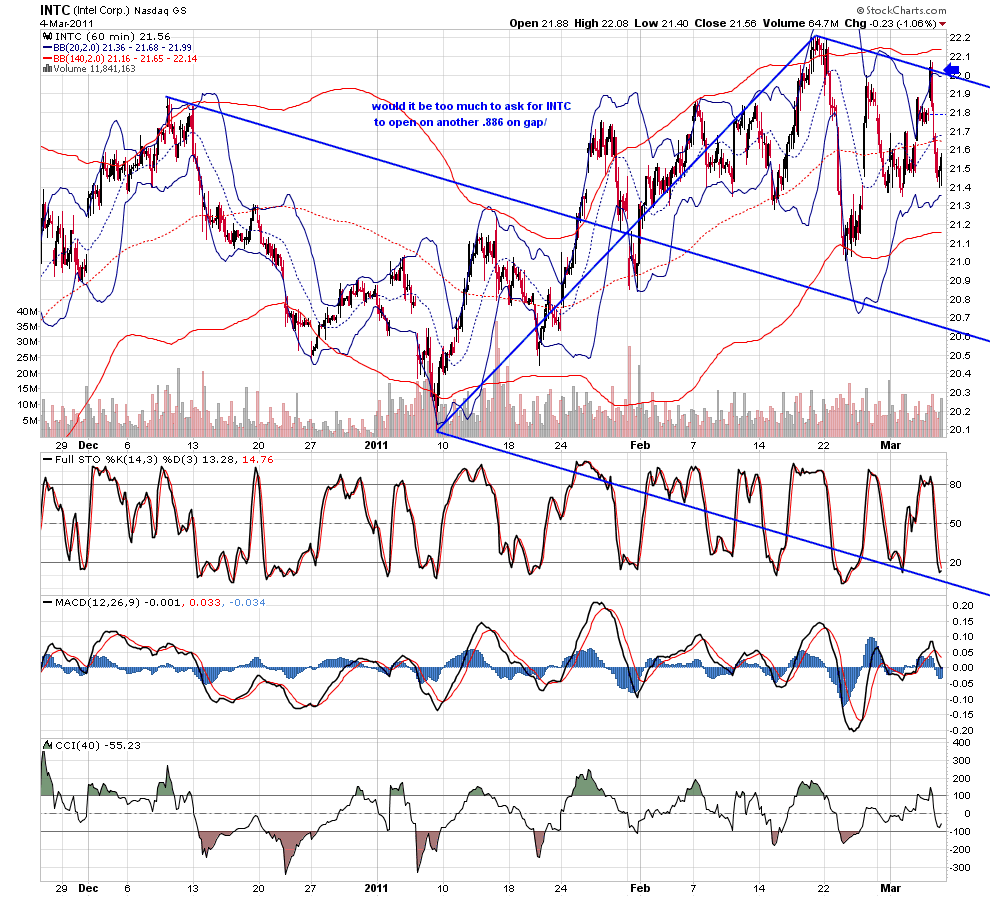
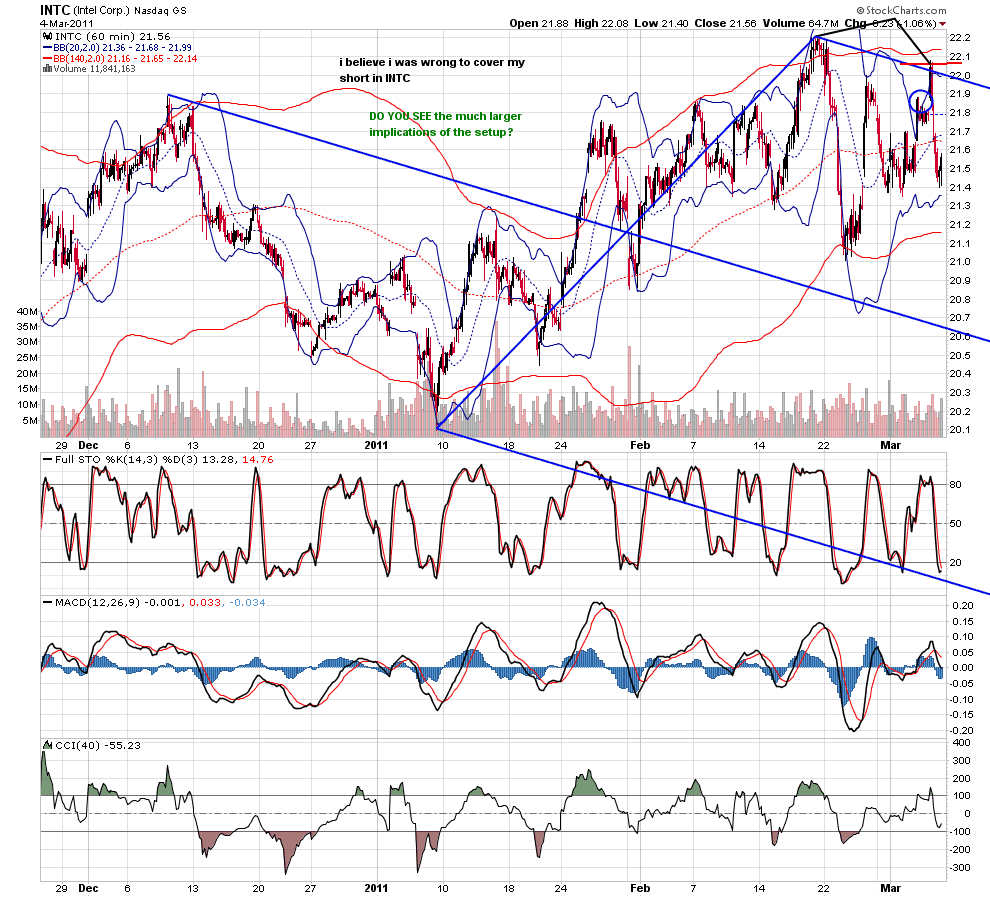
great thoughts roofer.....intc is amazing at the last high, the .886 was also 1.128 of interim high....I was thinking about your chart of uso from yesterday. it is interesting that it is where it is as the dollar has hit the target indicated by the abcd at the .382....you have said that this move sometimes indicates more...and here it is at a retest of the lower line...what next?
Click image for original size

Click image for original size
RO
roofer
Rep: 3,689
Posts: 3,574
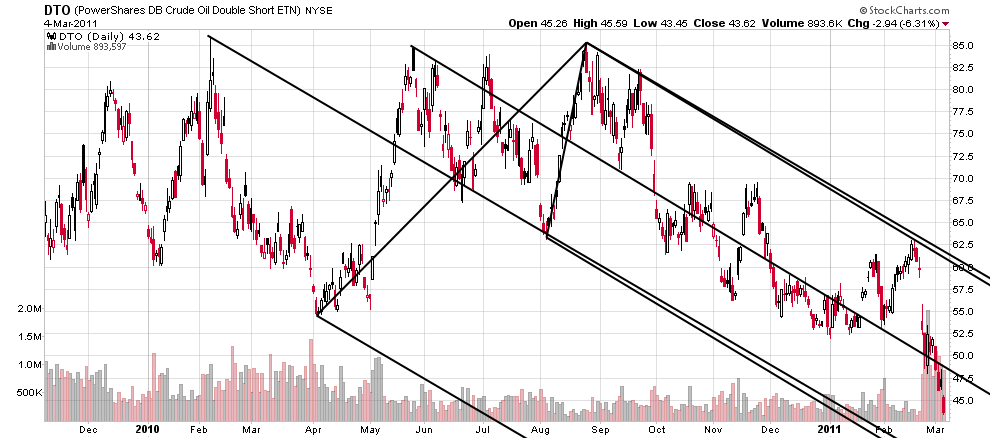
rat- i think i am wrong about a turn in oil....i have returned to the chart that initially got me focused on a big move in oil...it looks like a meltdown to me in dto... melt up in oil....
Click image for original size
RO
roofer
Rep: 3,689
Posts: 3,574
to sum up.... expect a move up near the open... see if the geometry has setup across the board....choose your trade signal...
Click image for original size

Click image for original size

Click image for original size

Click image for original size

Click image for original size
RO
roofer
Rep: 3,689
Posts: 3,574
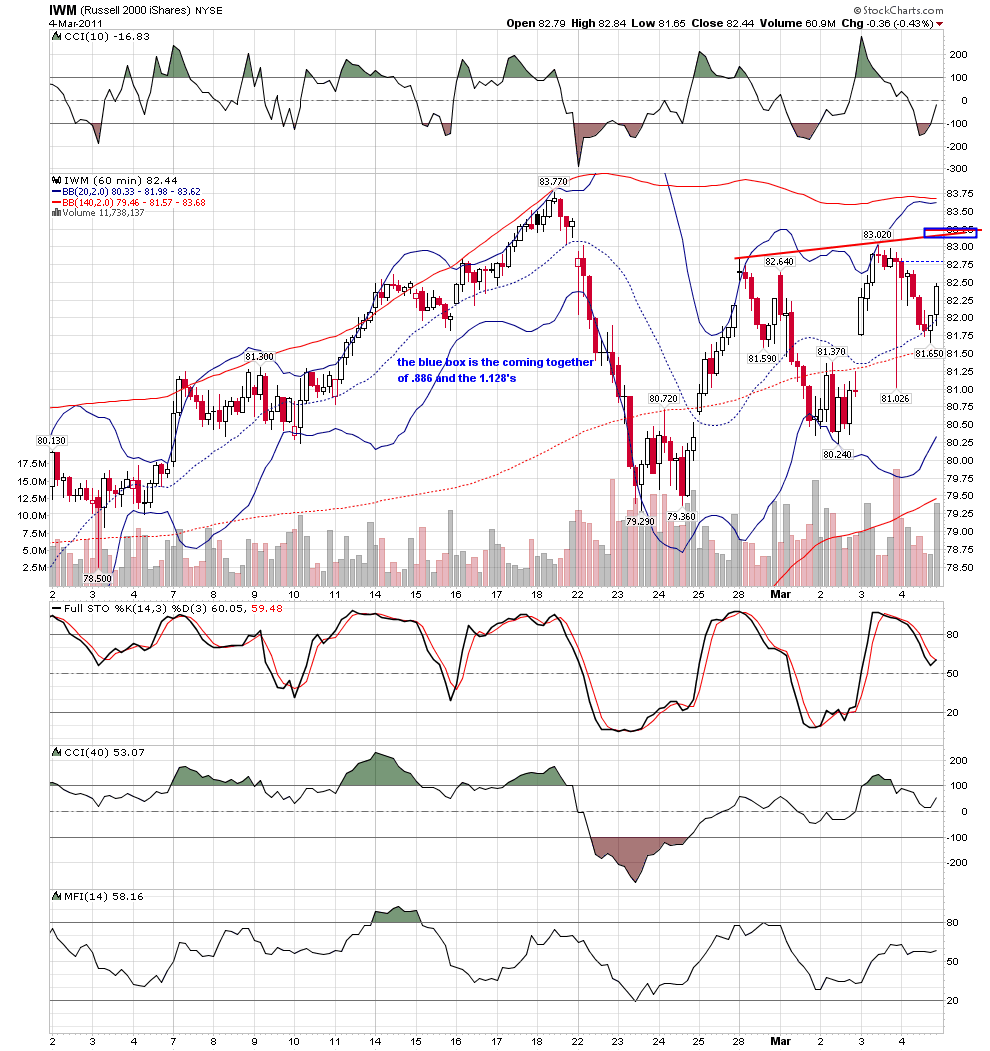
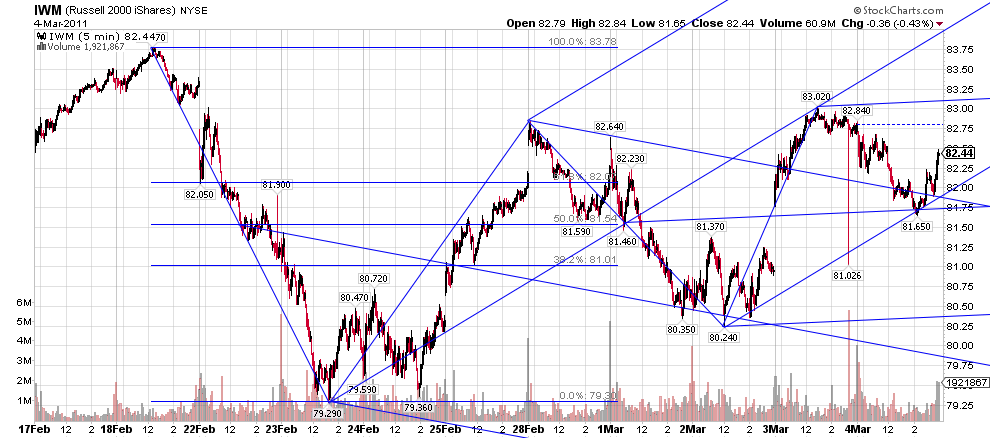
in retrospect,when looking at the IWM chart, the computers have been using the tools to trace out an ABCDE correction of a move, the completion of which we should see on monday. it simply is a pattern not seen frequently...in hundreds of individual charts, i need a push up monday to complete patterns....here is the rub... if i add up moves to minimum downside targets on the dow stocks, i get a move that takes price beyond the level most traders are looking for corrective action to complete...going past that level, traders will lose their bearings, pull their bids, and price would move quickly to the lower targets given by the coming together fib patterns and lines from medianline sets. that is the crash geometry.my plan is simple.. if a quick scan over key stocks and indexes shows the geometry in place across all the traders. i will take initial position at extreme... IF . the ma's roll i will pile on...most traders would be best served taking jim's more conservative route.
RO
roofer
Rep: 3,689
Posts: 3,574
Click image for original size
JI
jimkane
Rep: 3,058
Posts: 33,089
I agree, all I am hearing out there is very strong April, very strong June, much, much higher highs coming. Every last one. NYSE short interest at a super low level, bullish sentiment pegged super high. We'll see.