MyPivots
Sign In
RO
roofer
Rep: 3,689
Posts: 3,574
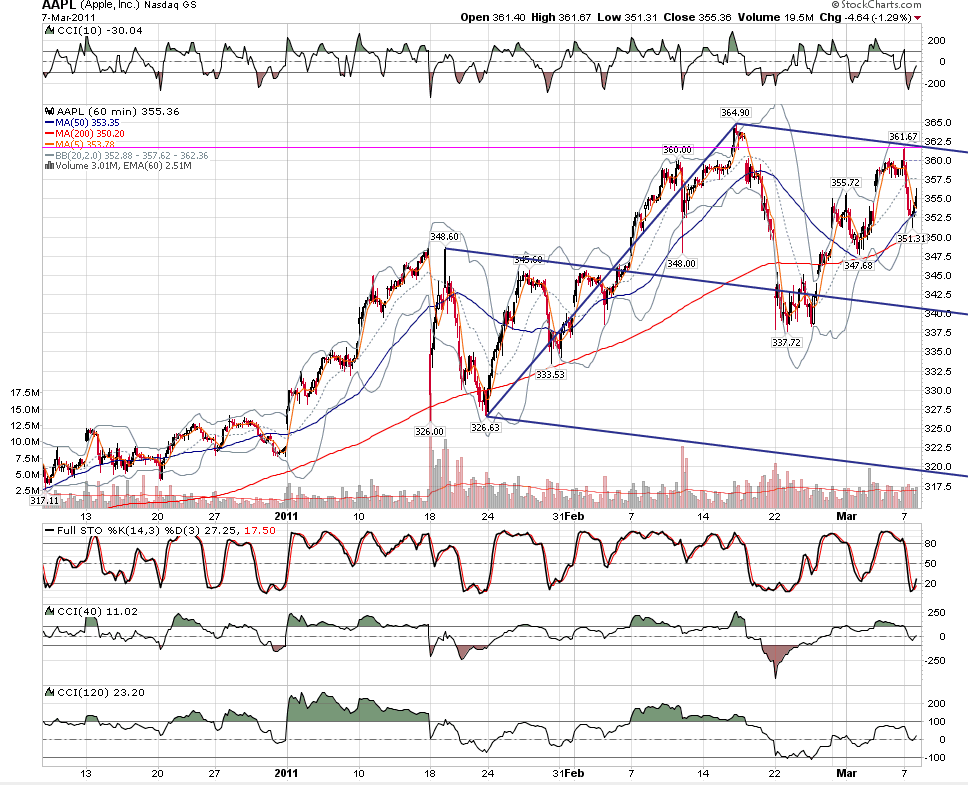
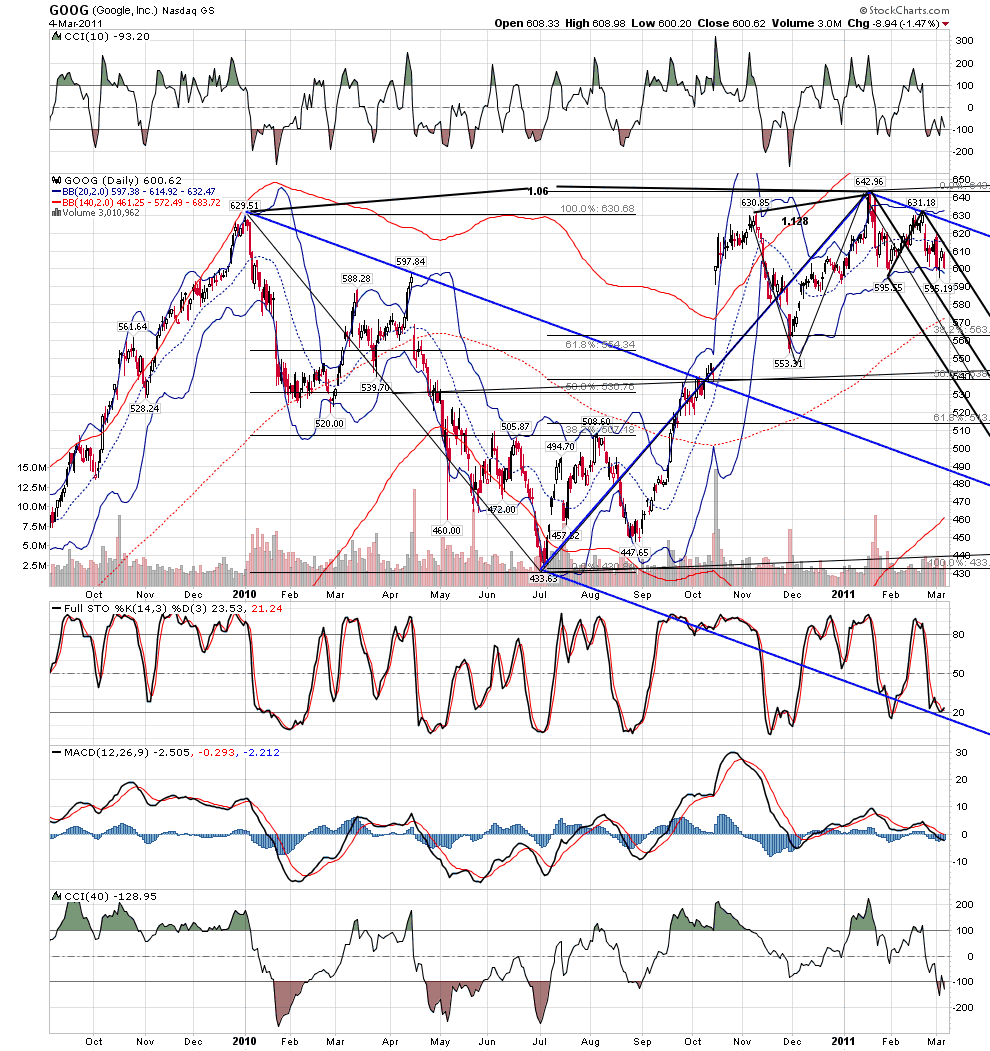
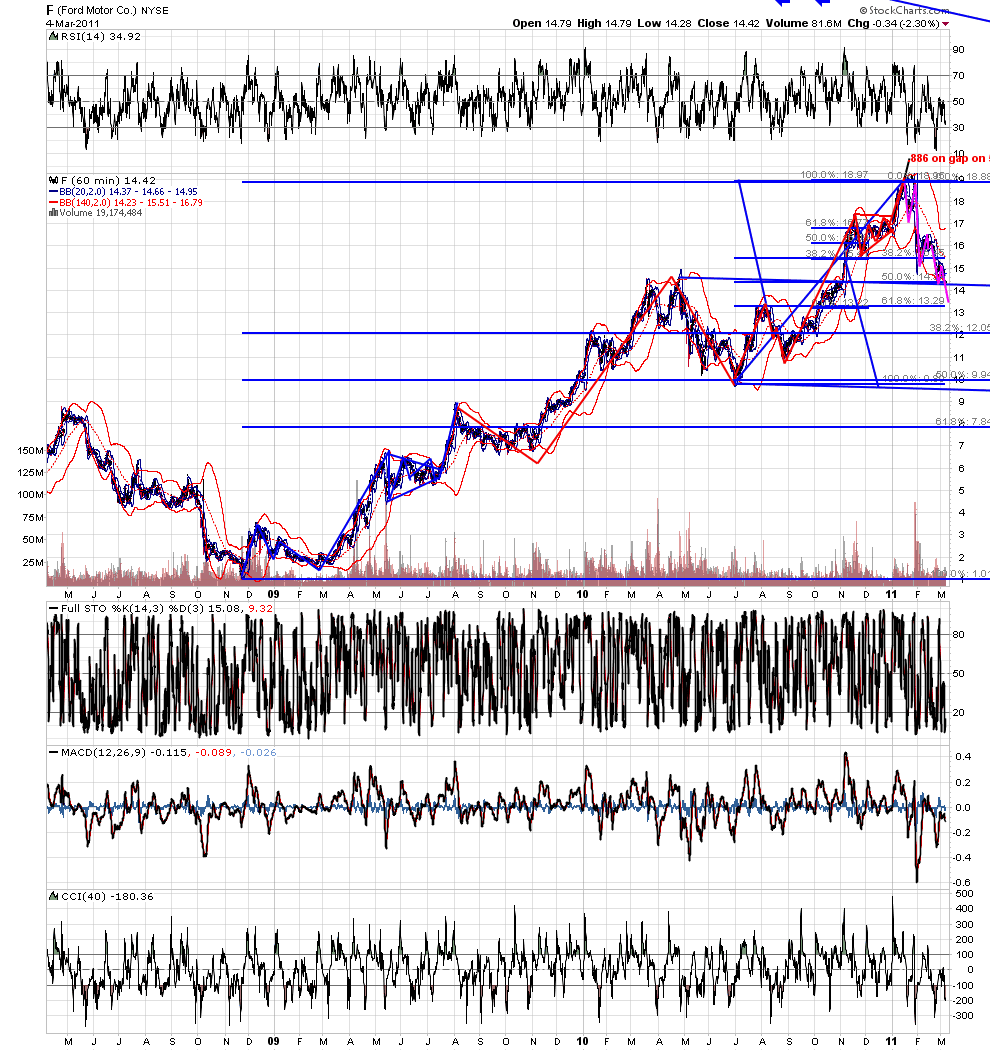
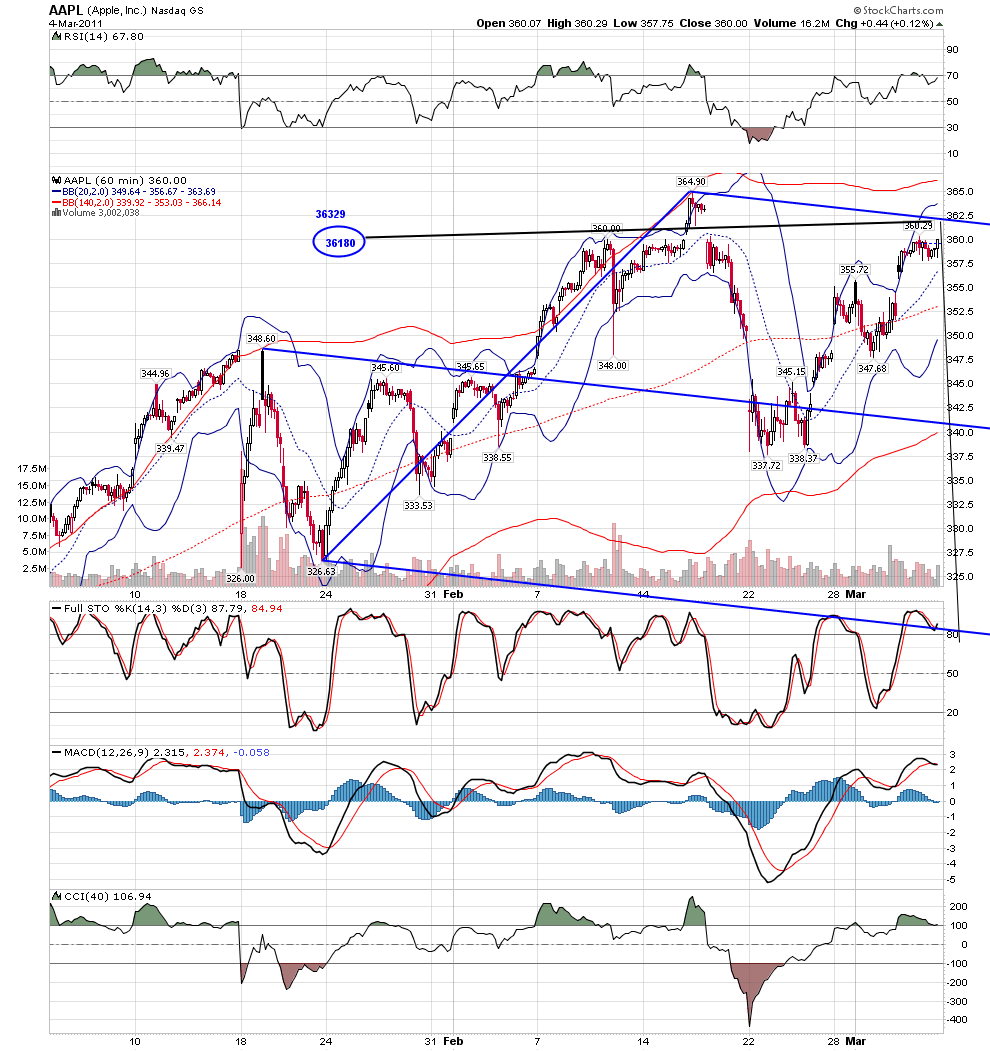
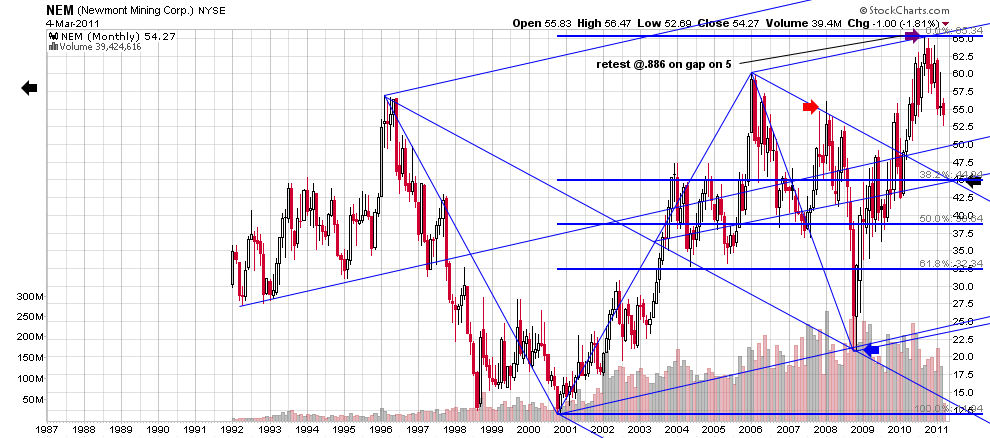
i appreciate deeply jim taking the time to post the links to how the oligarchs control our country and our markets.but the winds of change are about the land and people are actually thinking we need some change..... that is not a good thing for the oligarchs.... they are always a step or two ahead....how will they maintain their control? by orchestrating a crash and thus eliminating any chance that the qe's will not go on forever... i am only seeing this because it is in the geometry we trade... i keep track of stocks that have topped at .886 on gap on 5... using the geometry we trade i see downside targets to be met. way down ..with the time element. given by medianline sets saying now.. but the market has been held up by the oligarchs while they create massive short positions for their accounts...they are masters at deception.... the key is THE BIG DOG.... the most over owned overloved stock... they have held it up at all costs.. how could anything be wrong if AAPL sits just points from a new high.... but kane traders know...if on monday they open AAPL at .886 on gap on 5 at the geometry and then it turns down, i believe we are looking at a crash... if not... then perhaps i have just stayed up too late tonite... i have enclosed some charts... see the setup in AAPL...see the forcast i made months ago here that NEM needed to trade down despite the rise in gold... see how that trade must go now....see the classic blow up in F at .886 on gap on 5.. monday will tell the tale...
Click image for original size
Click image for original size
Click image for original size
Click image for original size
Click image for original size
Click image for original size
RO
roofer
Rep: 3,689
Posts: 3,574
there IS one alternative... that this is the most beautifully constructed hook i have ever seen since i have traded the combo of tools i use now.....if price rolls slowly off the geometry, most kane traders would be best served trying to catch the first abcd retrace off turn.
RO
roofer
Rep: 3,689
Posts: 3,574
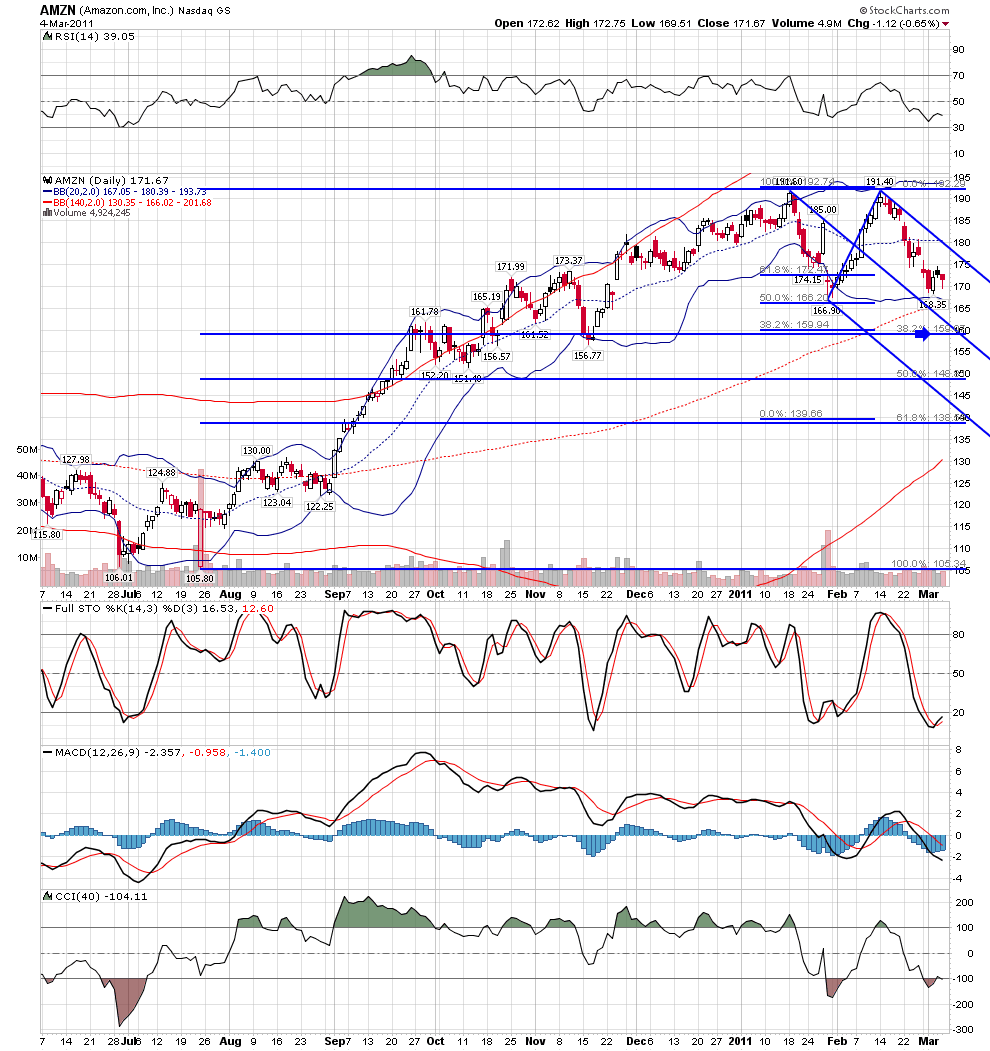
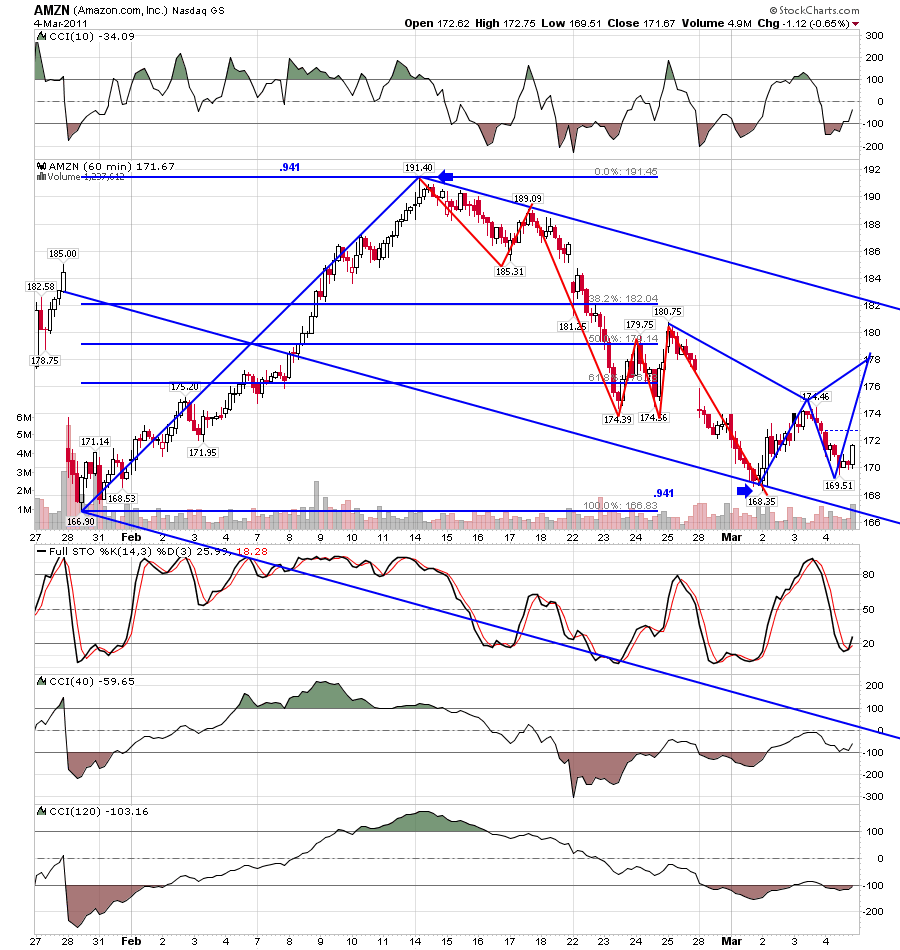
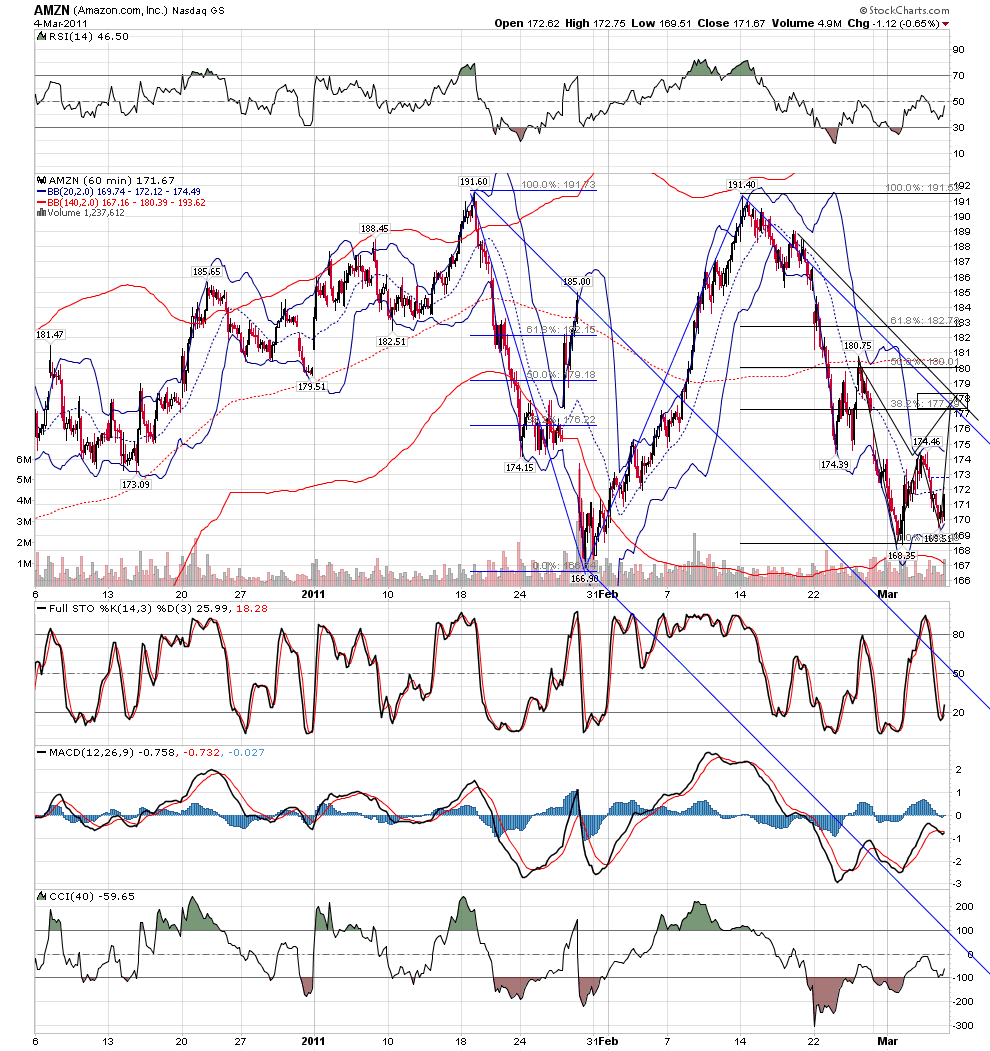
and what of AMZN....perhaps a kane 4 pt completed at recent low.... but it is very rare for a correction to complete on an initial 5 wave down.... what would make sense based on the geometry is a screaming short covering rally into kane zone at downsloping line completing an abcd.... at that point another 23 point drop, equal to the first drop, would take price to a coming together of lines from many time frames and would complete a kane double top abcd at the 1.46..... in the 155 area.
Click image for original size

Click image for original size
RO
roofer
Rep: 3,689
Posts: 3,574
rat... i am not a good currency trader... having said that, one of my big trades this year was an fxe trade based on what else, .886 on gap on 5..... the whole world is long euro/ short dollar.... time is telling me turn is at hand, geometry has yet to give me signal..
RA
rat89
Rep: 0
Posts: 7,015
I hear you....if oil does do what you suspect, dollar pushes to the lower line? It could make sense based on where it turned back down, thinking of that as a continuation. Isn't it true that currencies trend somewhat differently than stocks too?
JI
jimkane
Rep: 3,058
Posts: 33,089
This is a fantastic thread, roofer. I love the discussion part, since I do so much of that myself. I know it isn't necessary for short-term, technical trading, but for swing/position trades, I still like to do it, thinking I can add a little edge there. Regardless, I love to read your thoughts throughout the thread. Incredible chartwork, too.
RO
roofer
Rep: 3,689
Posts: 3,574
thanks jim.... just think... if i am correct... we could move the charts to the public kane forum, minus any 1.06, 1.46,.685, under the heading'' how one member predicted crash using kane tools.''if i am wrong, and it will be clear,, the heading could be'' how one trader stayed up too late and dreamed of a crash....'''to be honest.. i was just using my charts to find the end of a group of abcd pullbacks before price moved higher...then a trader showed me a dick arms article showing how current market structure remarkably looks the same as before previous crashes....so i did what i always do... i asked a simple question...the question is this... is there a stack of sell signals across a wide group of stocks such that if all signal were triggered it would result in a sharp sellof .as price moved to medianlines. answer yes... then bigger question...if selling gets out of control,, and prices move to lower // is there important geometry at the lower //'s... across hundreds od stocks the answer is yes in the form of completed kane abcd's and five point patterns...and then where i started.. what purpose would it serve the oligarchs to manufacture a crash? the answer to me is to maintain their strangle hold...crazy as it may seem.. my analysis of the SMH and individual chip stocks say we need an analyst upgrade on monday morning to trigger buying to complete patterns and yet at the same time we need downgrade of financials so that they rally not at all to maintain the potential rapids and waterfall setup...
RA
rat89
Rep: 0
Posts: 7,015
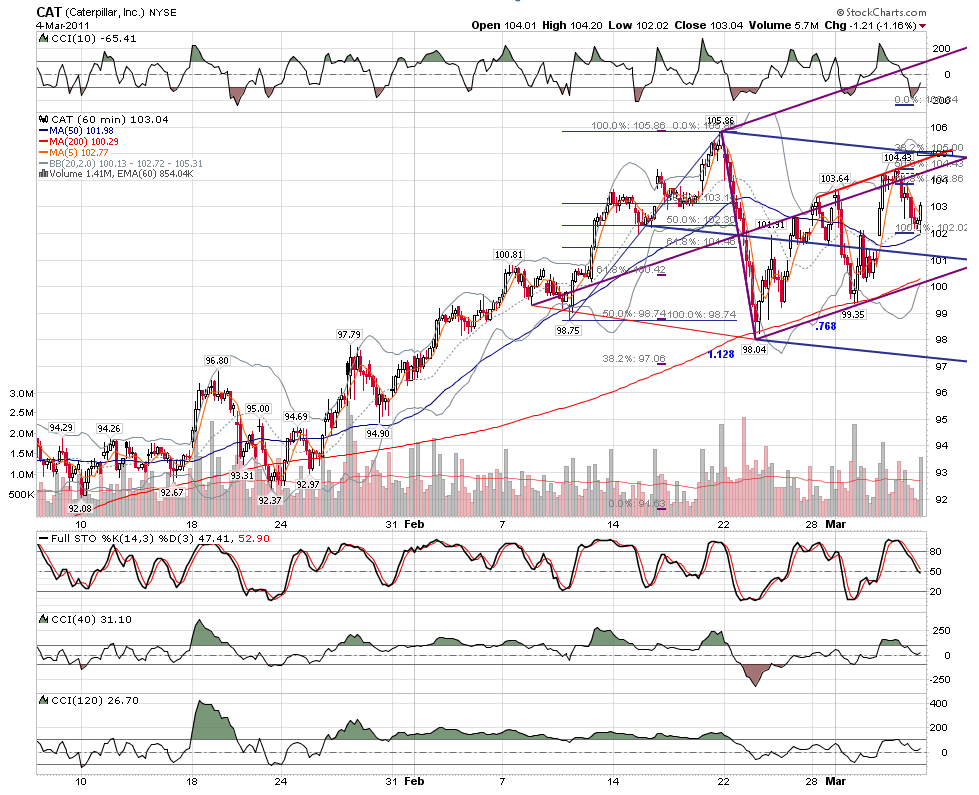
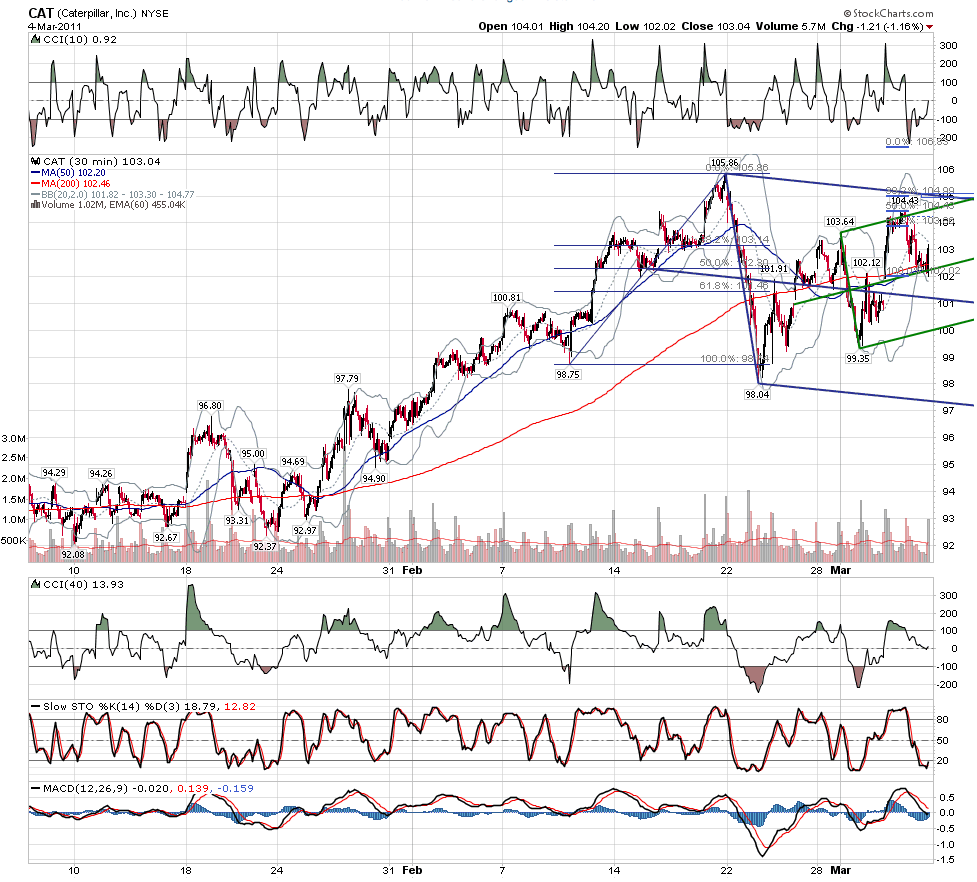
inspired by roofer and his cheery thesis on a rainy day i have been playing around with the cat....it just seems to perfect up there in an eleven cent box at 104.97 - 105.08......so many things converge there...
Click image for original size

Click image for original size
JA
jarek
Rep: 94
Posts: 3,474
Originally posted by roofer

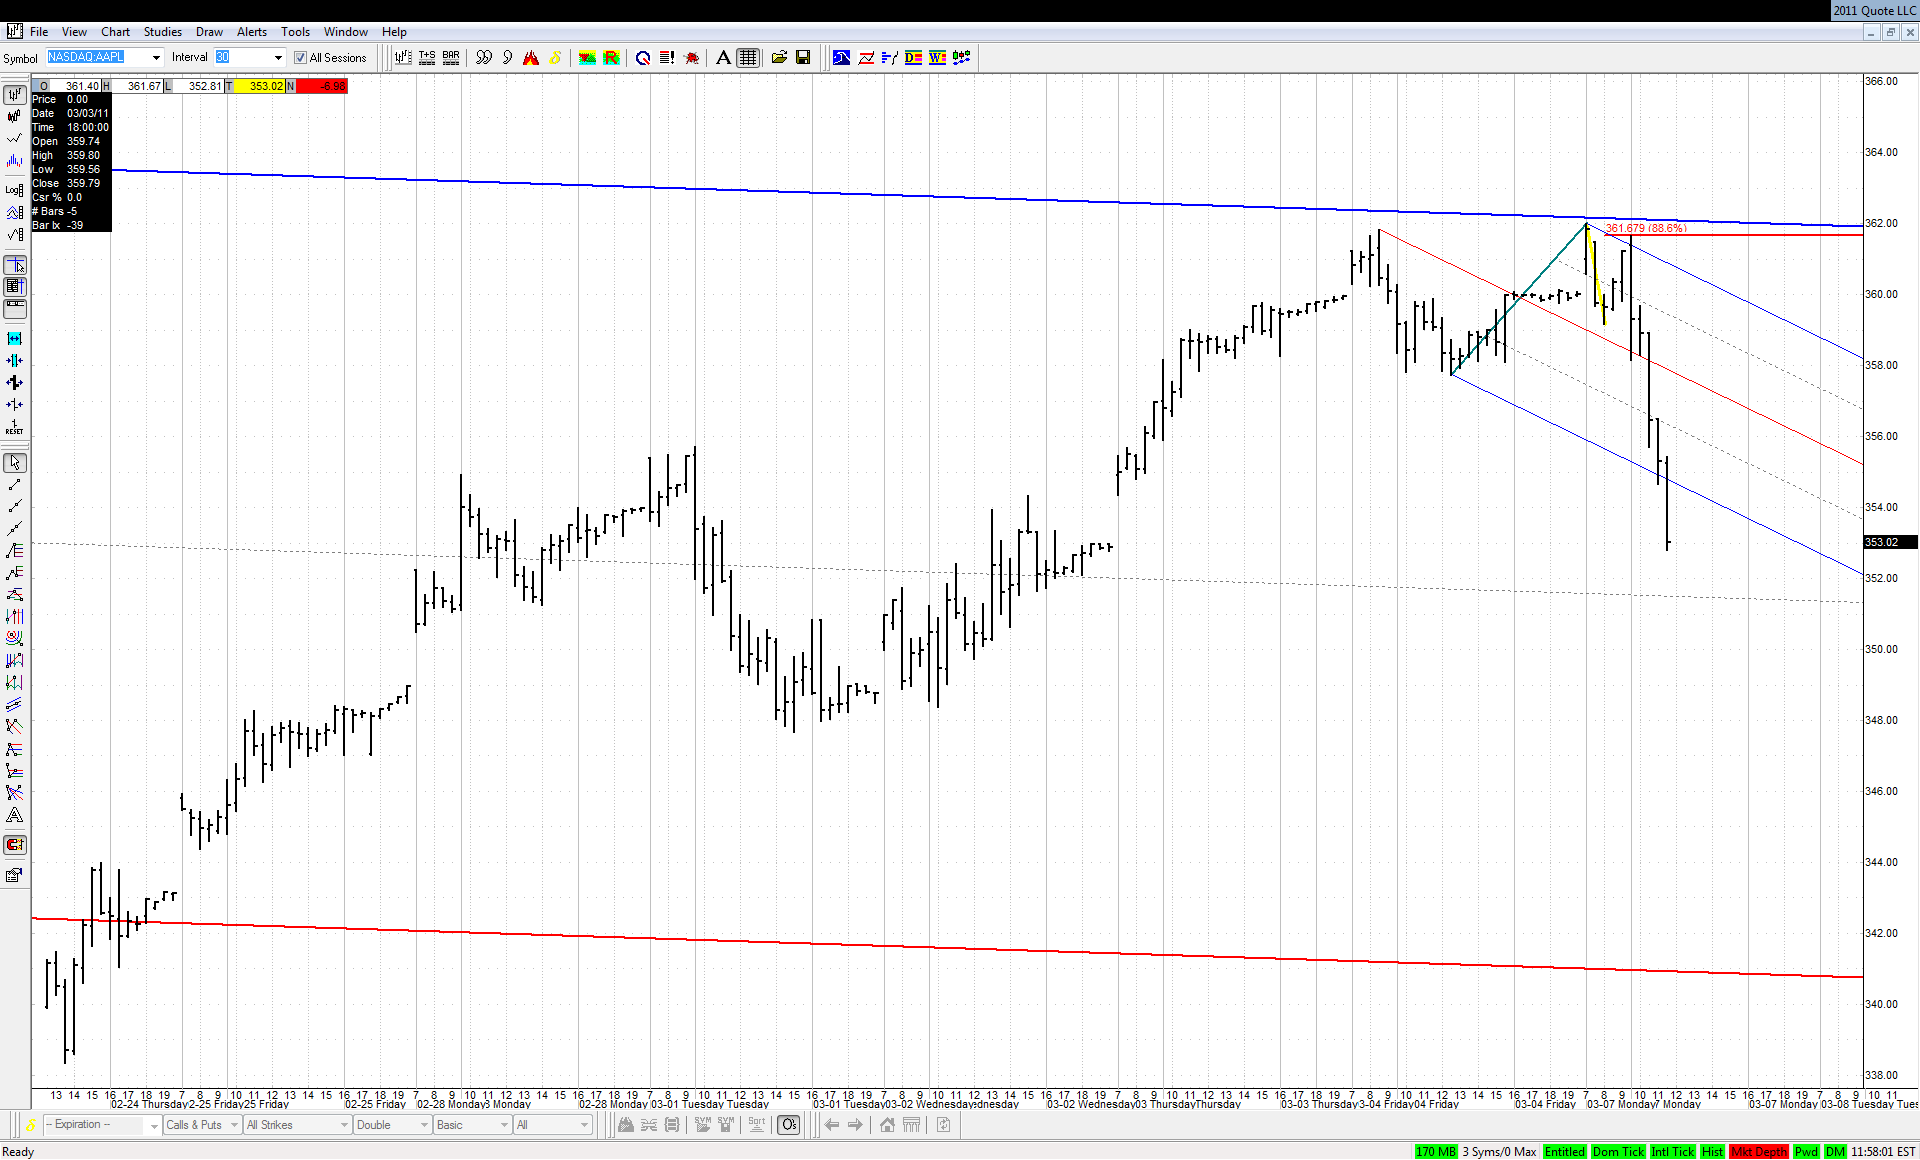
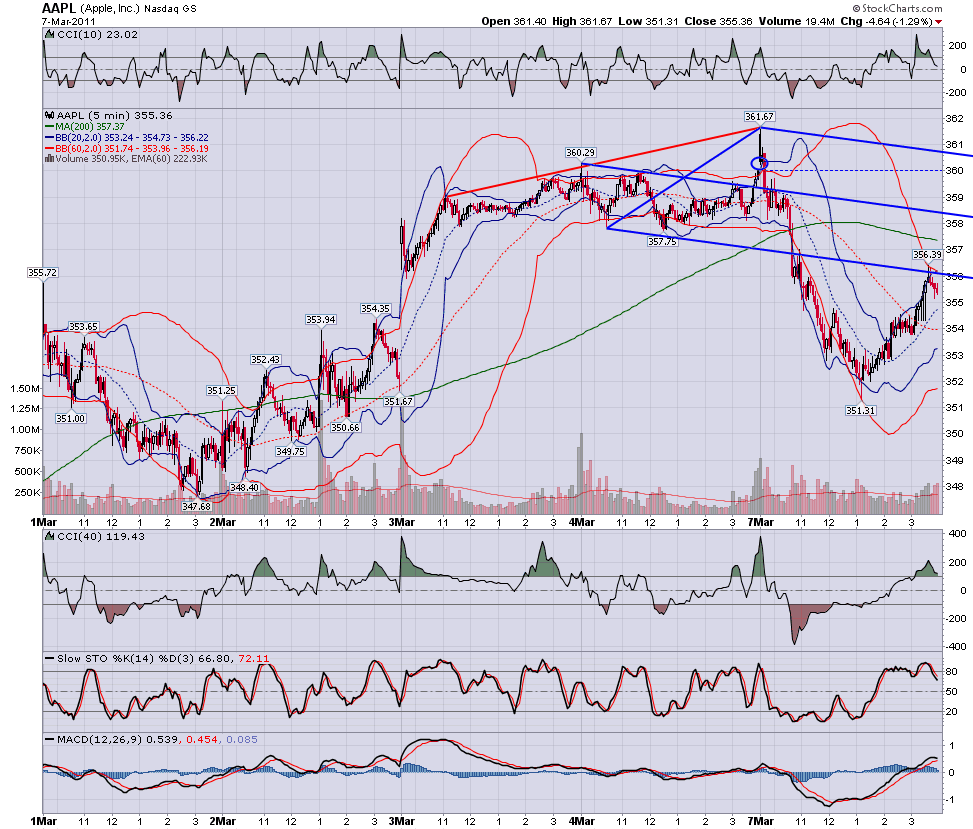
...if on monday they open AAPL at .886 on gap on 5 at the geometry and then it turns down, i believe we are looking at a crash...

I would have not believed if I hadn't seen it with my own eyes:

Click image for original size


Great, great respect Geo!
RO
roofer
Rep: 3,689
Posts: 3,574
jarek... in the end i do not matter.... the tools matter....but thanks...
RA
rat89
Rep: 0
Posts: 7,015
me either!


I would have not believed if I hadn't seen it with my own eyes:


Click image for original size

Click image for original size
JI
jimkane
Rep: 3,058
Posts: 33,089
I agree, all I am hearing out there is very strong April, very strong June, much, much higher highs coming. Every last one. NYSE short interest at a super low level, bullish sentiment pegged super high. We'll see.