ES Trading for 4-11-11
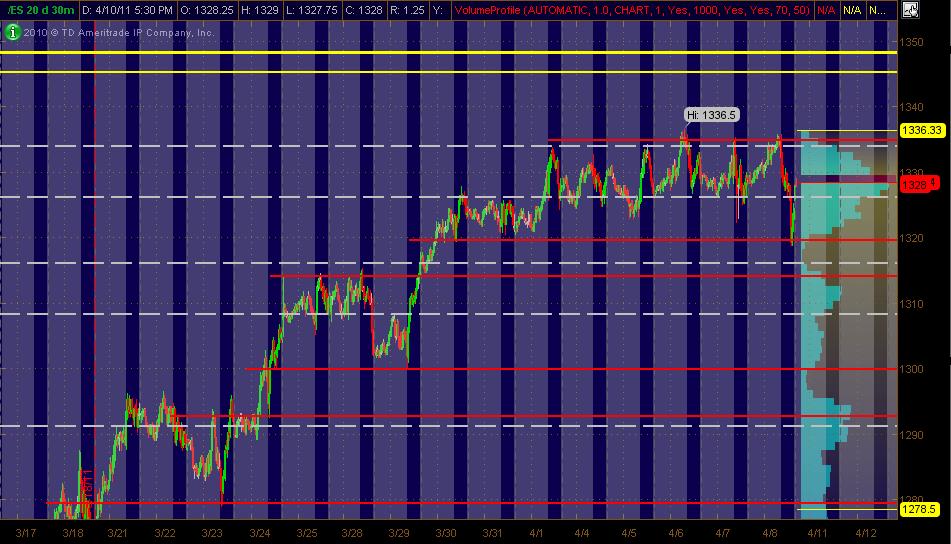
Here's my MAP of the ES coming into the week ... 30min chart of 20 days with Volume Profile on the right vertical axis. The PASR levels are RED with the WHITE dashed lines being Weekly Pivots per mypivots.com with YELLOW lines being a "zone" of what I've got as potentially significant FIB clusters. Hope it's helpful
Click image for original size
great trading bruce !
good point...they use up all the volume trying to reach the overnight high so when it gets there , no volume is left for the breakout
Originally posted by pt_emini
not much buying interest up here at 1330.00
thanks....I wanted to make sure I was out in front of that 24.50 volume I had and the VA low is at 23.75...u just never know at those spots....
Originally posted by apk781
great trading bruce !
They kissed that 24.50 level right to the tick, excellent read on the market this morning Bruce !
Originally posted by BruceM
thanks....I wanted to make sure I was out in front of that 24.50 volume I had and the VA low is at 23.75...u just never know at those spots....Originally posted by apk781
great trading bruce !
Bruce,
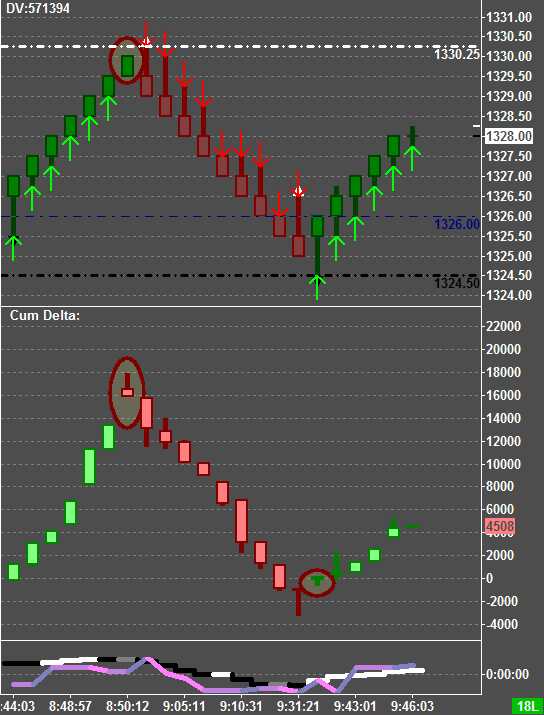
This was an excellent example of the value of Cum Delta.
Selling increased with price going higher. Trend changed after Cum Delta changed. The "event"(cum delta) vs. the "coincidence" (29 volume node).
This was an excellent example of the value of Cum Delta.
Selling increased with price going higher. Trend changed after Cum Delta changed. The "event"(cum delta) vs. the "coincidence" (29 volume node).
Click image for original size
very nice beyond...do u run that just in RTH session...? Lorn has had good results with the combined...
I like the concept......what data feed do u use...? I need a major upgrade for my delta research
I like the concept......what data feed do u use...? I need a major upgrade for my delta research
why do u say selling increased as price went higher? It looks as if Cumulative delta ( CD) went higher as price went up..?
what's the best visual to relate the CD ( volume) to the total volume..? not sure if that makes sense as a question...
I use DTN for my data, for the price it has the best bid/ask data. If you only rely on your brokers data feed, you will never know when there is a problem, until it's to late.
I run it with 24 hr data, just to keep my charts up to date.
The charting package you use is also important. I have tried them all, used IRT/Market Delta but found there was a problem in some of their routines. Ninjatrader is useless for any serious delta work, unless you are willing to coble together third party studies or do the programming yourself.
Finally settled on Sierra Charts, when a legitimate deficiency has been pointed out they do something about it. It also gives the user the greatest ability to adjust how the data is used and displayed, in other words the most customizable without being a programmer.
Originally posted by BruceM
very nice beyond...do u run that just in RTH session...? Lorn has had good results with the combined...
I like the concept......what data feed do u use...? I need a major upgrade for my delta research
Originally posted by BruceM
why do u say selling increased as price went higher? It looks as if Cumulative delta ( CD) went higher as price went up..?
You can see the hilited CD was negative, selling increasing and price went up a little higher, price can't continue higher on increased selling delta.
thanks for explaining that MM. Looks like we are heading down in the overnight to the next key area 1310.50- 1312.50.
Emini Day Trading /
Daily Notes /
Forecast /
Economic Events /
Search /
Terms and Conditions /
Disclaimer /
Books /
Online Books /
Site Map /
Contact /
Privacy Policy /
Links /
About /
Day Trading Forum /
Investment Calculators /
Pivot Point Calculator /
Market Profile Generator /
Fibonacci Calculator /
Mailing List /
Advertise Here /
Articles /
Financial Terms /
Brokers /
Software /
Holidays /
Stock Split Calendar /
Mortgage Calculator /
Donate
Copyright © 2004-2023, MyPivots. All rights reserved.
Copyright © 2004-2023, MyPivots. All rights reserved.