ES 4-27-2011
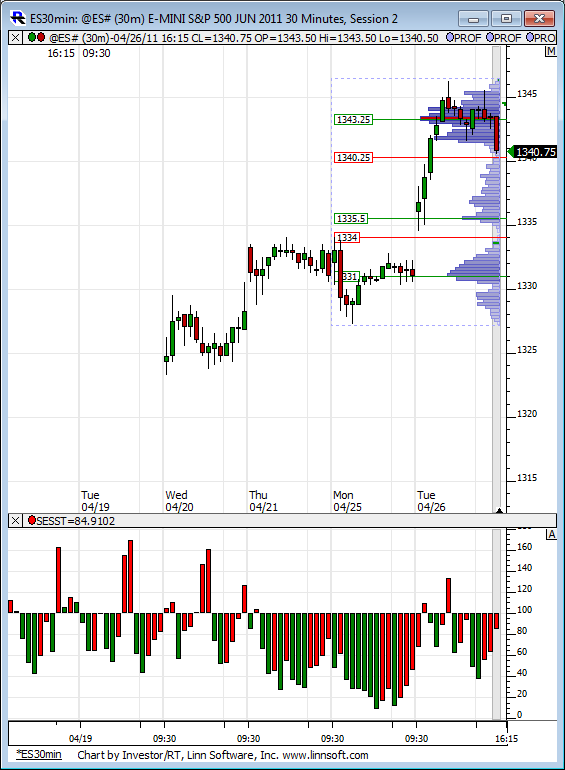
Here is a 30-min chart with the developing profile for the week. On the lower pane I have a relative volume study giving feedback for the past 200 trading days. Quite interesting the rally over the last week has come on some seriously weak volume in relative terms to the last 200 days of trading.
Notice the one bar from todays session which is about 130% above normal 200 day volume, that came on the high reversal bar for the day...
Notice the one bar from todays session which is about 130% above normal 200 day volume, that came on the high reversal bar for the day...
Click image for original size
biggest opportunity is if they do a first push up but also biggest risk as the key number 1350 looms above!!
started core RTH shorts at 45.75...ultimate goal now can be the gap fill but we have lots of work to get there.......plan is still target 44 for O/N positions
Really nice call bruce
Originally posted by BruceM
started core RTH shorts at 45.75...ultimate goal now can be the gap fill but we have lots of work to get there.......plan is still target 44 for O/N positions
thanks....so far so good..we have a low volume push away from the 44 so I expect it to return to that number again
next target will be low volume of 42.50 from YD
Love watching bonds as they move up minis move down
Originally posted by BruceM
next target will be low volume of 42.50 from YD
Good morning,every one.
It looks like much weakness in ES!
It looks like much weakness in ES!
well ,if there is a double top pattern in ES 30min chart,the book target will be 1340.5-(1346.5-1340.5)=1334.5
Looks like bears gave up
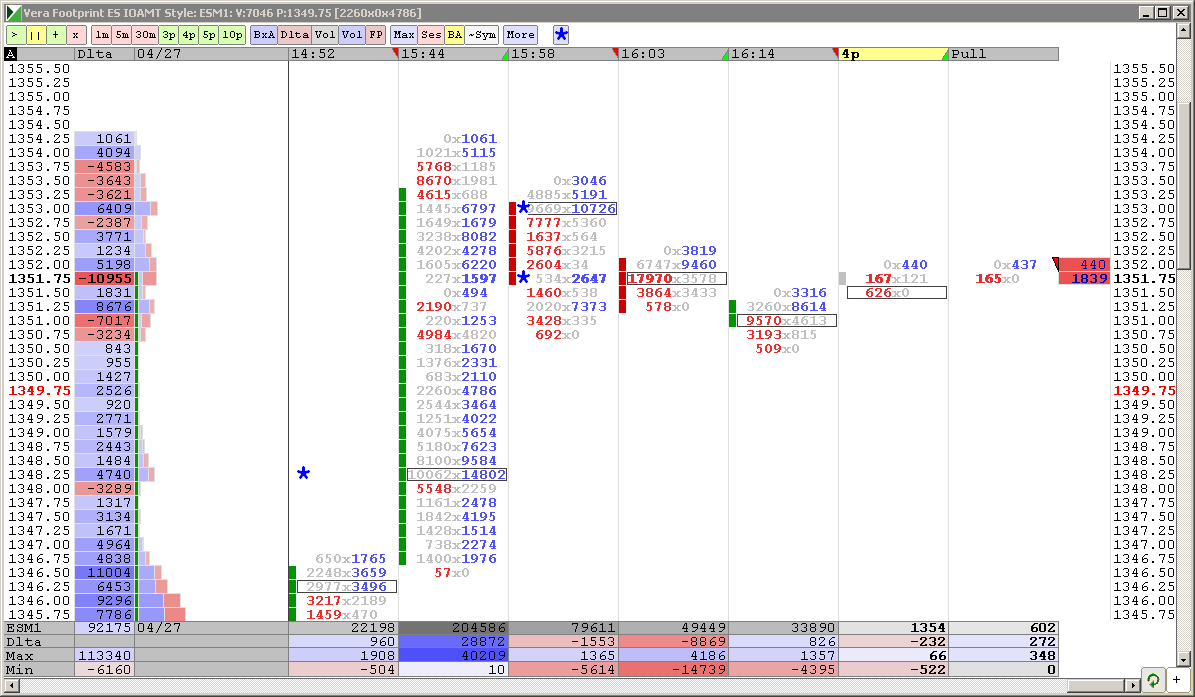
Click image for original size

my market is left-justified, so could not place it near the cell in 3P column
Last chart for today...lol
Click image for original size
Emini Day Trading /
Daily Notes /
Forecast /
Economic Events /
Search /
Terms and Conditions /
Disclaimer /
Books /
Online Books /
Site Map /
Contact /
Privacy Policy /
Links /
About /
Day Trading Forum /
Investment Calculators /
Pivot Point Calculator /
Market Profile Generator /
Fibonacci Calculator /
Mailing List /
Advertise Here /
Articles /
Financial Terms /
Brokers /
Software /
Holidays /
Stock Split Calendar /
Mortgage Calculator /
Donate
Copyright © 2004-2023, MyPivots. All rights reserved.
Copyright © 2004-2023, MyPivots. All rights reserved.