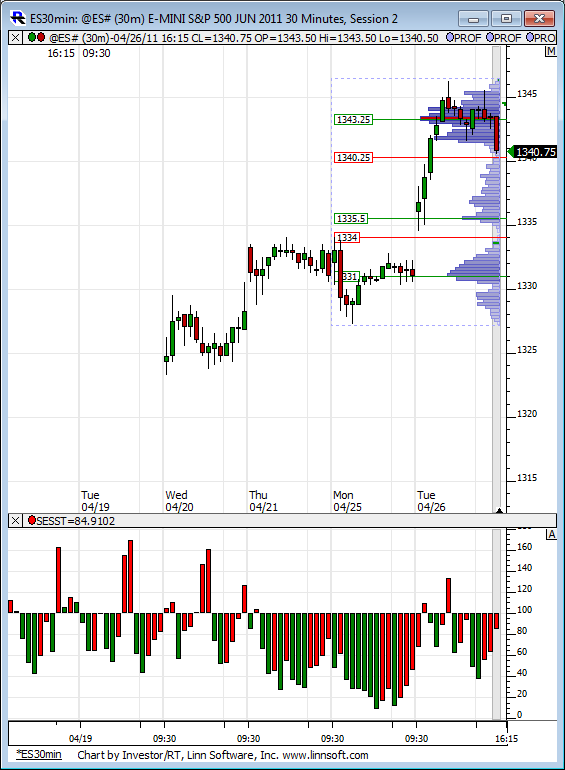
ES 4-27-2011
Here is a 30-min chart with the developing profile for the week. On the lower pane I have a relative volume study giving feedback for the past 200 trading days. Quite interesting the rally over the last week has come on some seriously weak volume in relative terms to the last 200 days of trading.
Notice the one bar from todays session which is about 130% above normal 200 day volume, that came on the high reversal bar for the day...
Notice the one bar from todays session which is about 130% above normal 200 day volume, that came on the high reversal bar for the day...
Click image for original size
Btw ... Lorn, your charts are always great and helpful!
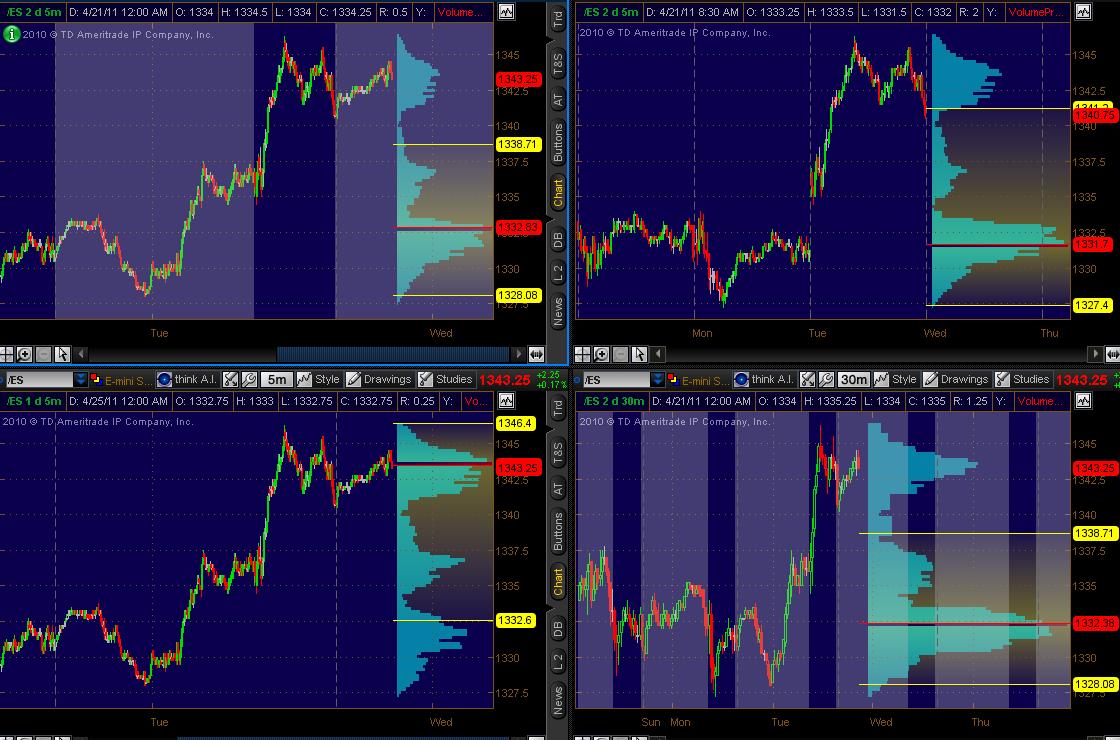
Still tinkering with ThinkorSink/Swim's capabilities. Have Volume Profile charts. Fwiw, here's what it's showing ... have 4 charts:
Top Left: 5min chart of 2 days data ATH
Top Right: 5min chart of 2 days data RTH
Bottom Left: 5min chart of 1 days data ATH
Bottom Right: 30min chart of 2 days data ATH
Lemme know if this matches up with what others are seeing with different software. Maybe this is helpful/useful in some respect.
Click image for original size
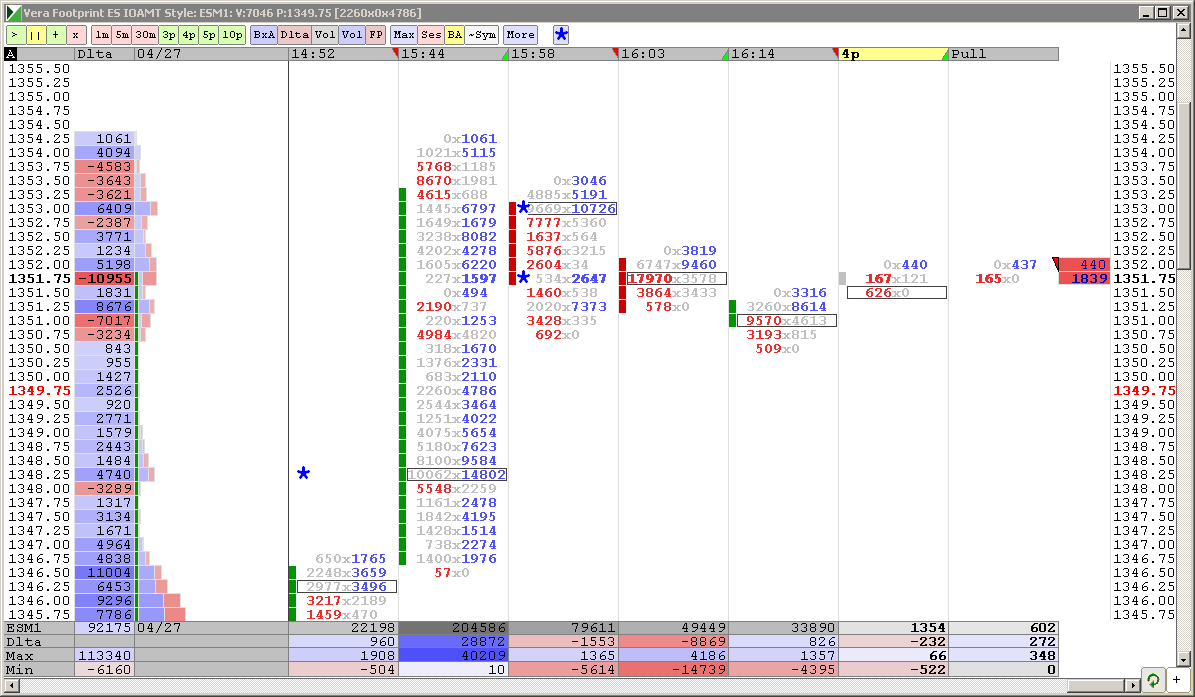
I'm looking at yesterday afternoons trade as just a mini bell shaped curve. So I'm looking for sells as close to the outer edge of that distribution...... close to yesterdays highs. With target being near the center and that 42.50 area from yesterday. If the overnight trade was looking lower then I'd be looking to buy below.
Like any consolidation we need to be aware of STRONG volume trying to break away from the consolidation and form new value at higher or lower levels.
Internally we seem diverging as mentioned by Red in MM's stock thread and Lorn has shown evidence of High volume on down reversal bars. So I prefer the short side up here.
The Volume points from that afternoon distribution are 1341.75 and 1344....so a more conservative exit on any initial shorts would need to take something off first near the 1344 and then go for the 42.50..
Seems like we either get short now in the Overnight or we may miss our chance
just a quick note on today's schedule; most of you probably know this by now but just in case: the fomc statement will be released at 12.30pm et (not at the regular 2.15pm et) and then at 2.15pm et bernanke will be offering the first ever FOMC press conference, Q&A included (a la ECB) that is expected to last about 45 minutes.
Hey MM,
The 5 min chart, 2day of RTH should look the same as my chart posted above. As you can see they look similar but not quite the same...probably just graphical and not data related.
Cheers
The 5 min chart, 2day of RTH should look the same as my chart posted above. As you can see they look similar but not quite the same...probably just graphical and not data related.
Cheers
well ....we have a chance...starting shorts at 45.75....44 will be the target but my trade doesn't matter really....we'll see if volume comes in to blow me away or if we mean revert back into the consolidation
I'm hoping they run those out Lorn to add to short side before 44 prints.
both your charts show a nice bell curve.....if anyone is looking for a visual
Interesting to see what kind of day this turns out to be.
Downside Trend Day or Upside Breakout Day?
Downside Trend Day or Upside Breakout Day?
Originally posted by BruceM
I'm hoping they run those out Lorn to add to short side before 44 prints.
I think they tried the upside breakout day yesterday.......so I'm not counting on that at least not early on....and it may not be a downside trend day....we may just consolidate..
averaged in now at 46.25.....moving target up to 44.25.....will not add until day session.....and these On positions are light due to my crappy O/N trading record
averaged in now at 46.25.....moving target up to 44.25.....will not add until day session.....and these On positions are light due to my crappy O/N trading record
Last chart for today...lol
Click image for original size
Emini Day Trading /
Daily Notes /
Forecast /
Economic Events /
Search /
Terms and Conditions /
Disclaimer /
Books /
Online Books /
Site Map /
Contact /
Privacy Policy /
Links /
About /
Day Trading Forum /
Investment Calculators /
Pivot Point Calculator /
Market Profile Generator /
Fibonacci Calculator /
Mailing List /
Advertise Here /
Articles /
Financial Terms /
Brokers /
Software /
Holidays /
Stock Split Calendar /
Mortgage Calculator /
Donate
Copyright © 2004-2023, MyPivots. All rights reserved.
Copyright © 2004-2023, MyPivots. All rights reserved.