MyPivots
Sign In
JA
jarek
Rep: 94
Posts: 3,474
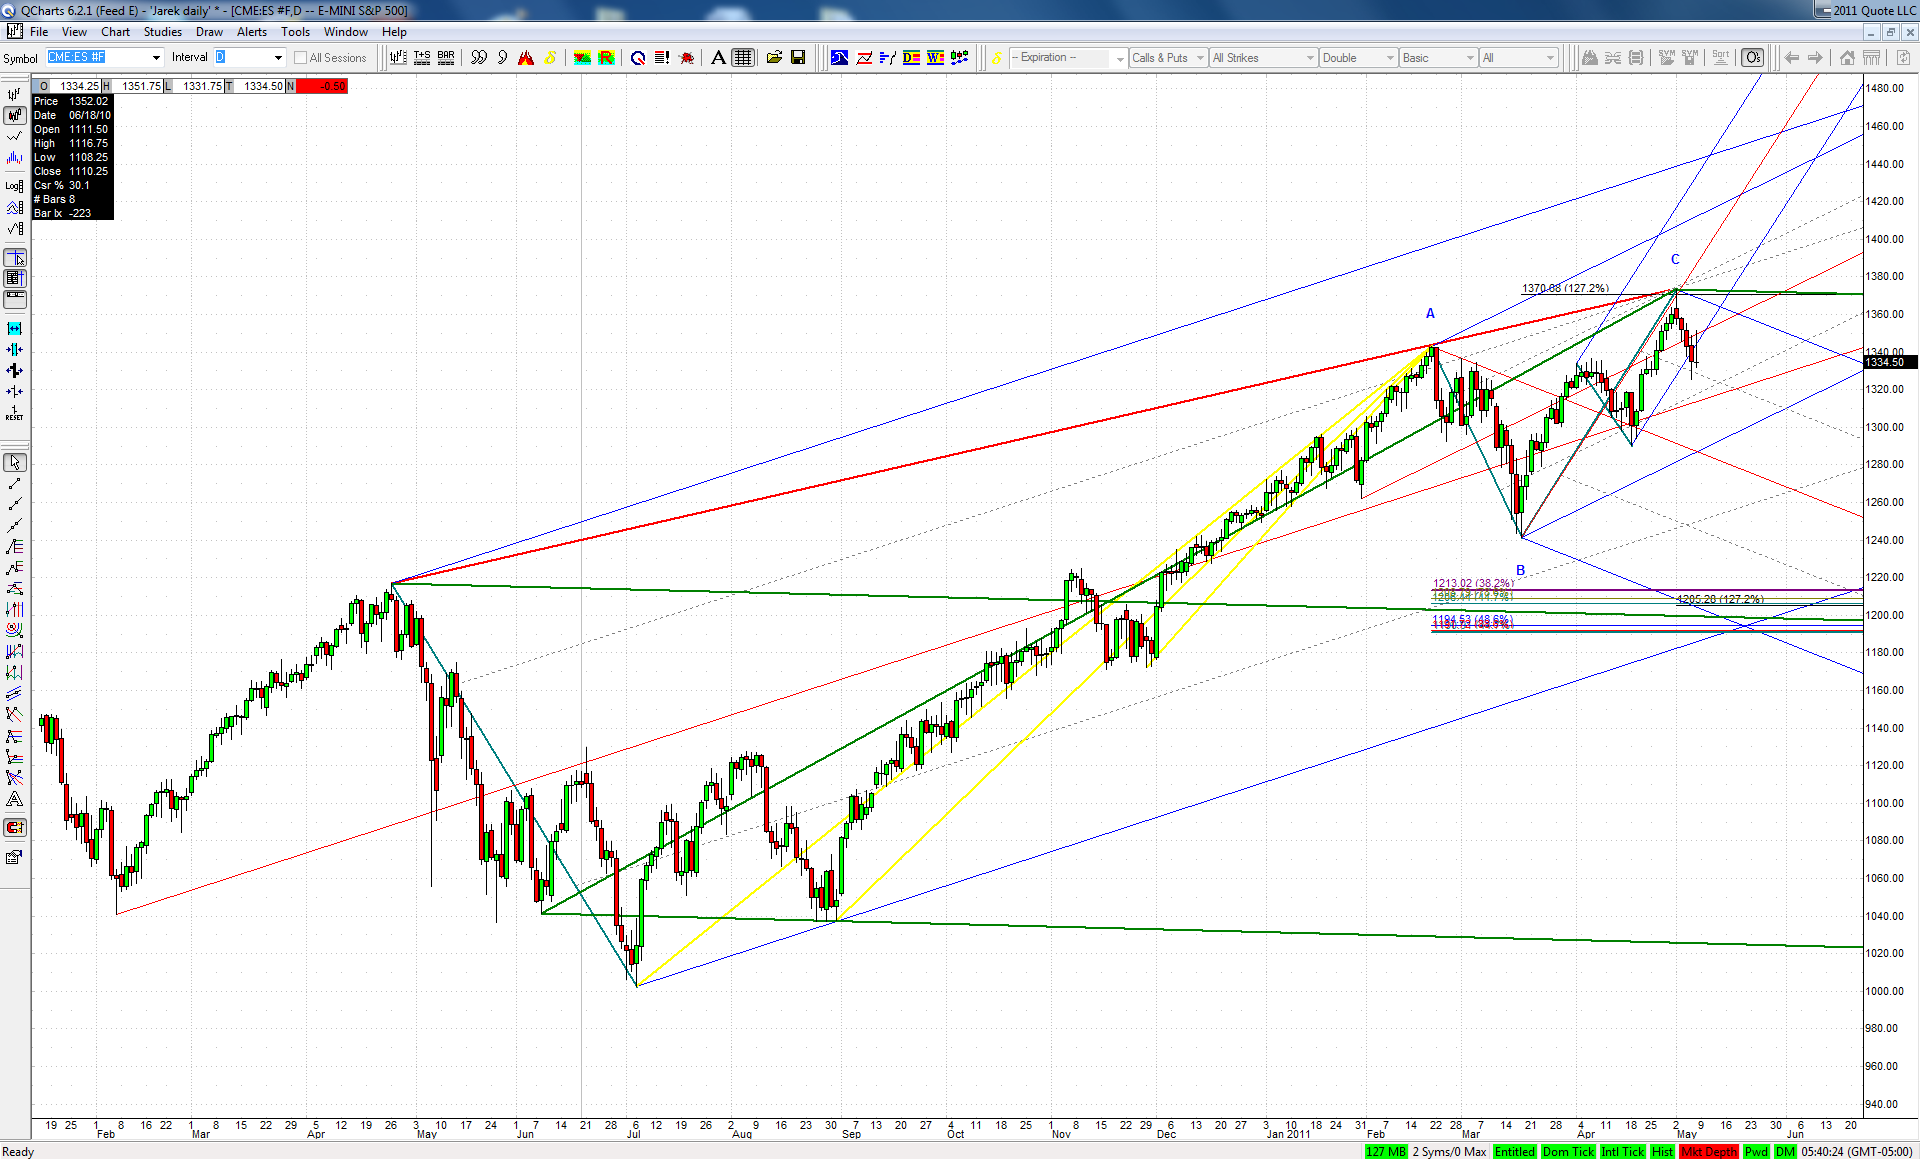
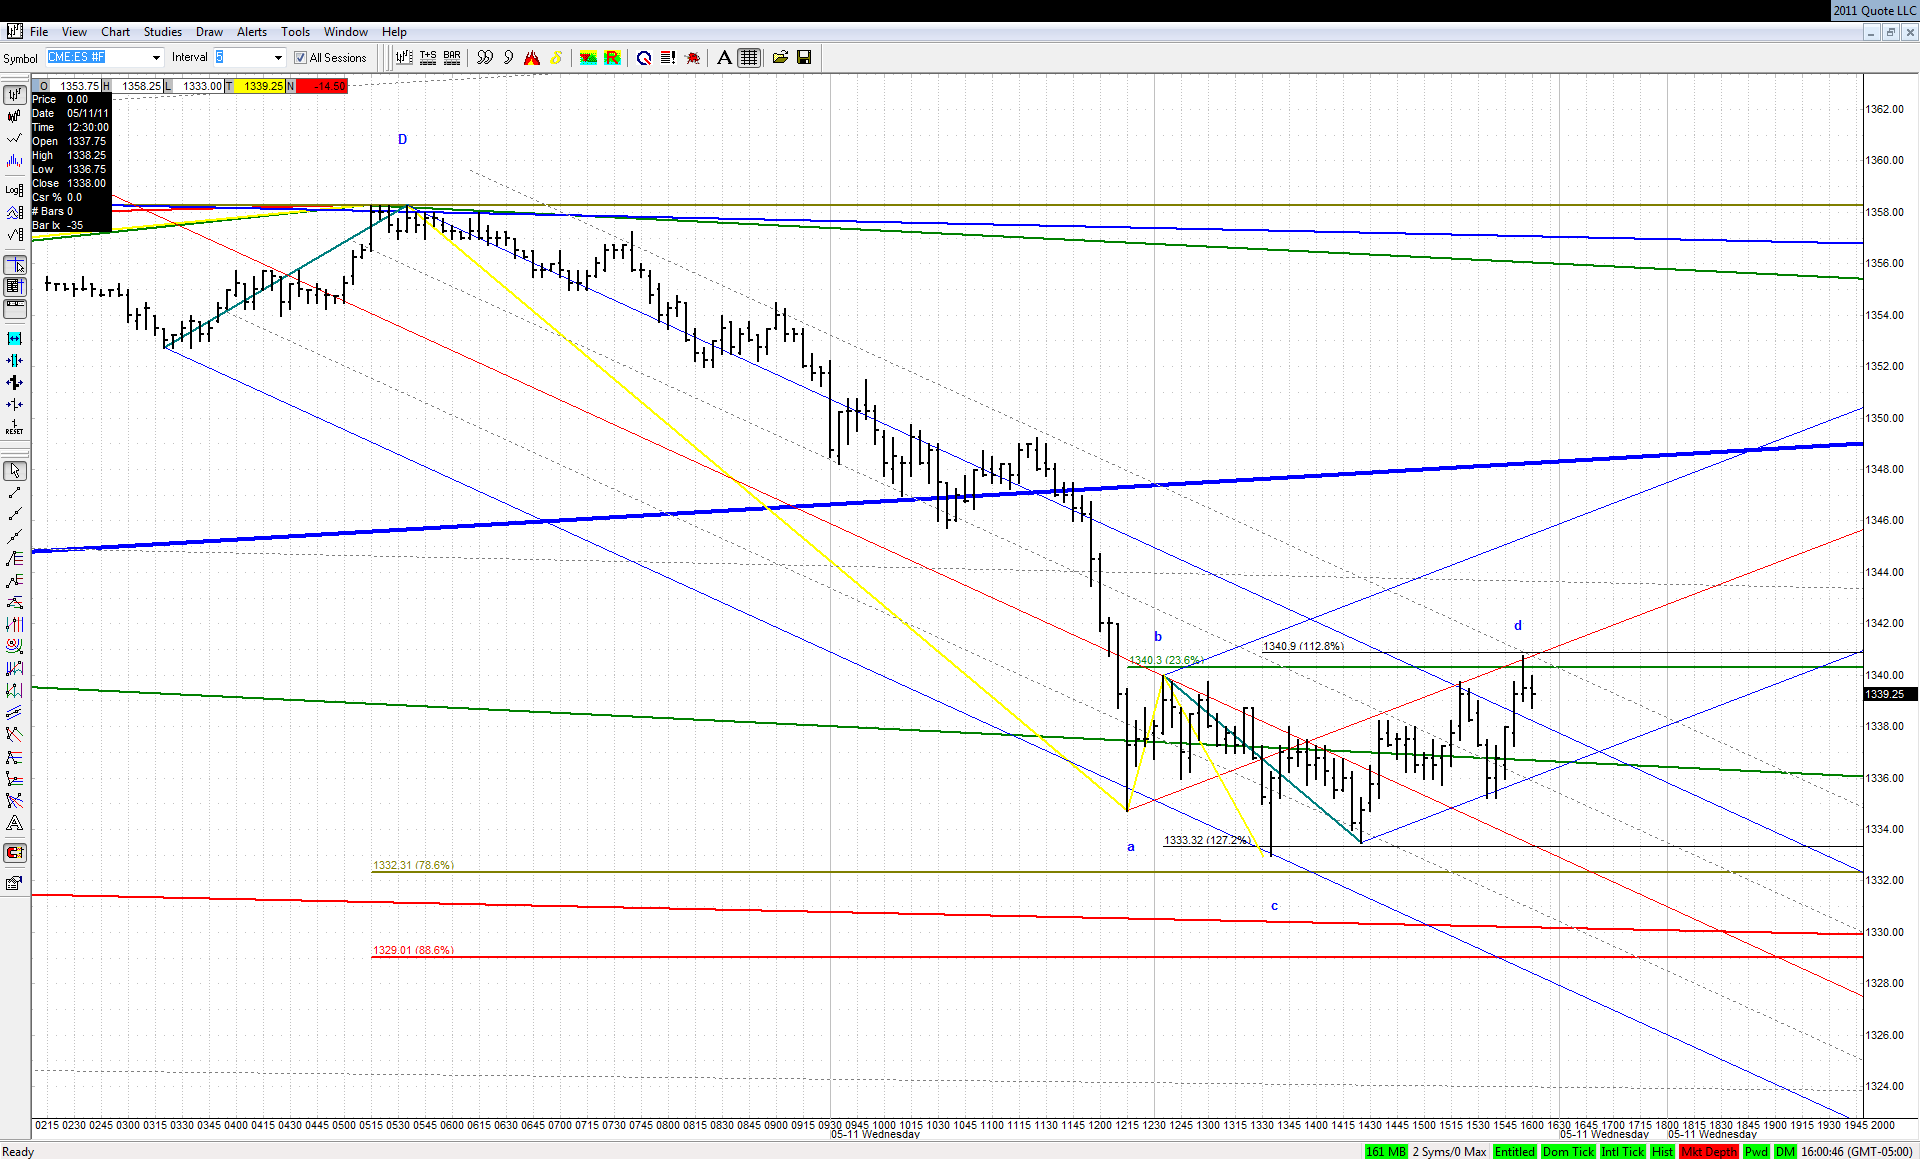
Here is my chart of the weekend:

Click image for original size
JI
jimkane
Rep: 3,058
Posts: 33,089
Totally stupid, this market is. Down off the ABCD, right to the first notable area, and then up like a rocket, right back to the range top. Will they finally take that out at cash close, or right after? Third day in a row with a little action in the AM or overnight, and then just HC all day.
JI
jimkane
Rep: 3,058
Posts: 33,089
Yep, all day chopfest, rolling in the range. BTW, when I said low end of the range, I didn't mean the low end of the little range it was in, I meant the range would sit on the low end of the daily range, in other words, we wouldn't get an expanded range back up to roll in. This is the habit I see it do, whether the big move was up or down. It forms a range near the HOD or LOD, one that is small compared to the size of the move, and then rolls in that for the rest of the day.


Originally posted by jimkane

...Most likely scenario, I think, is chop at the low end of the range...
JI
jimkane
Rep: 3,058
Posts: 33,089
Well, at least they got the stops for the range before the cash close, by three ticks. Some surprise...
JA
jarek
Rep: 94
Posts: 3,474
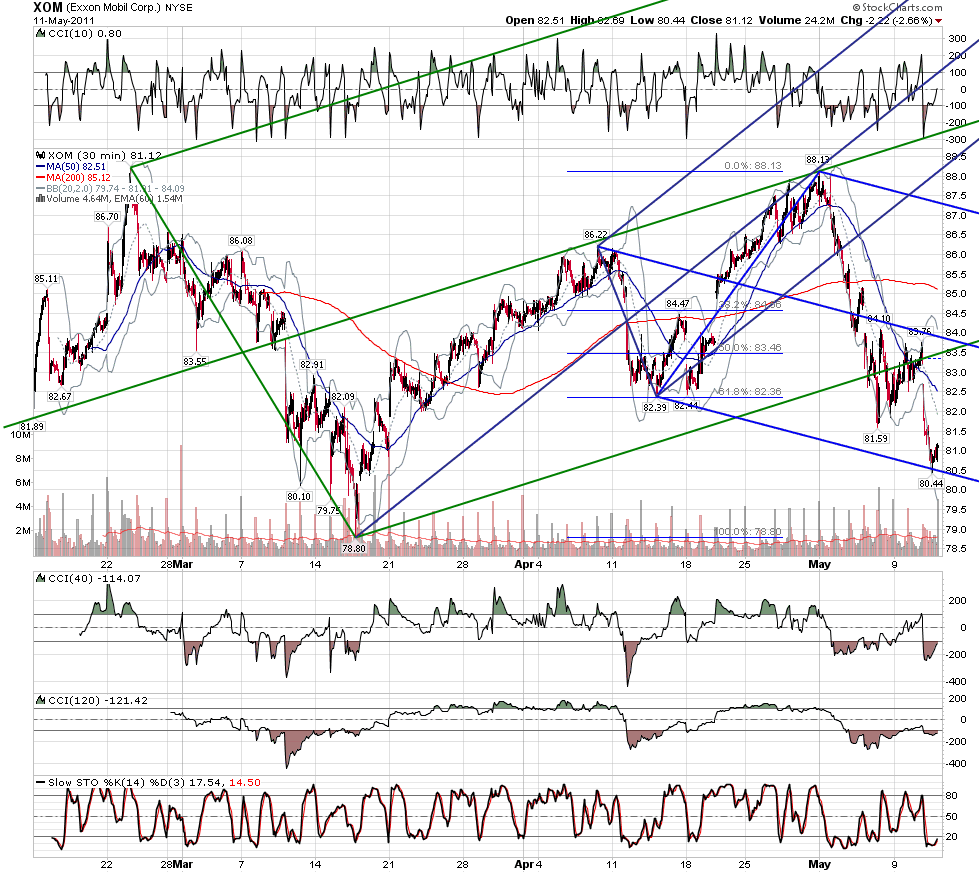
Not a TD ABCD, so maybe the EXP one?


Click image for original size
RA
rat89
Rep: 0
Posts: 7,015
Click image for original size
JI
jimkane
Rep: 3,058
Posts: 33,089
Hey, Jim, where are you looking at crude, on a little higher timeframe? I've got a key area right around 92, and then there is the obvious TL area below, from 90 to just below that. The latter area is sooooooo obvious, though, if it gets there I'd expect some serious games.
JI
jimkane
Rep: 3,058
Posts: 33,089
ES areas I'm really watching are 1327 and just over 1300. On the way 1316 is also worth watching for me (note the .447 is at 1314.50). The .382 at 23 is just below the recent low for the move off the 'top', so you can see about where things could start happening.
TX
tx_ches
Rep: -10
Posts: 514
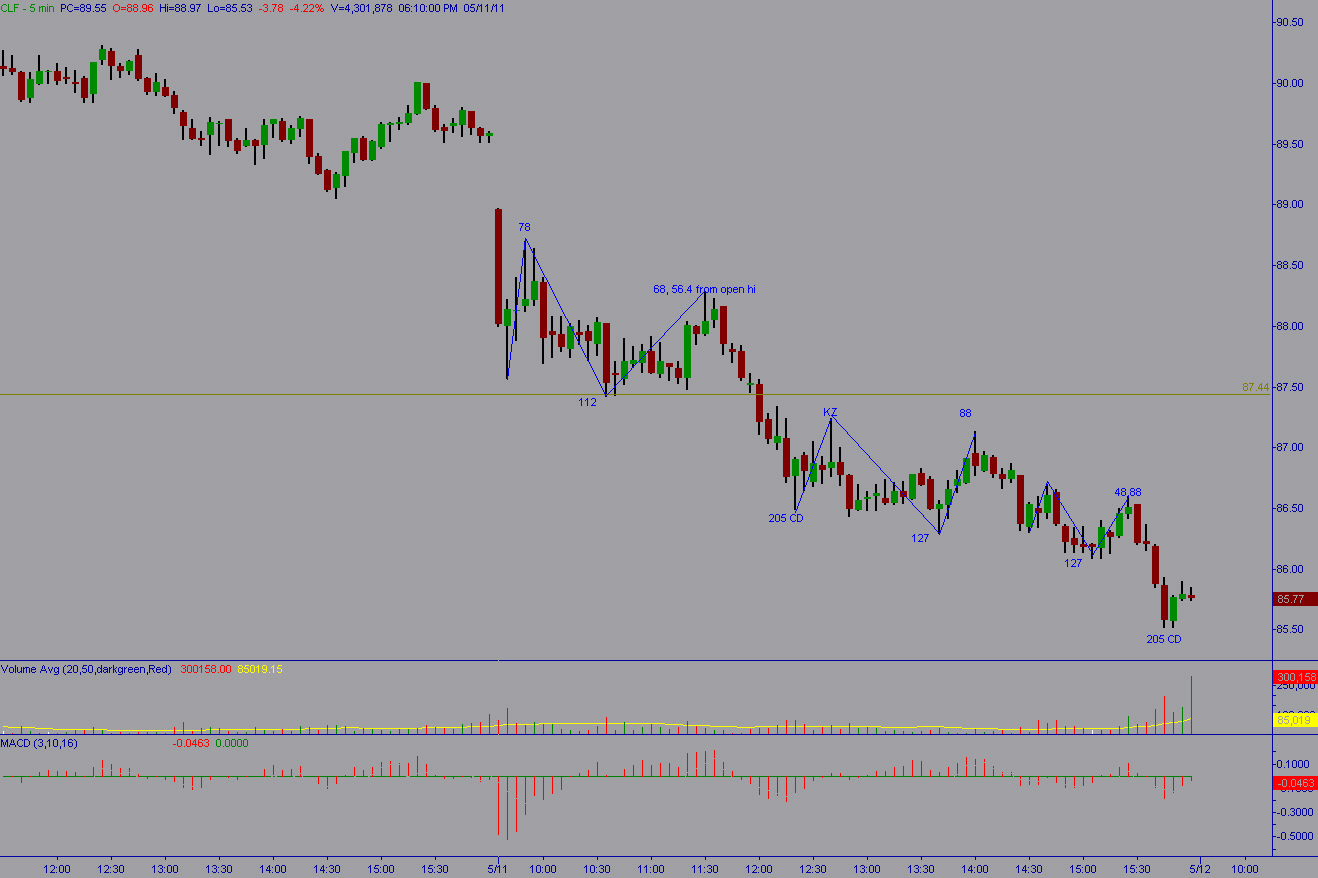
CLF 5 min gave plenty of ABCD's to get short.
They also gave me opportunity to better my entry techniques to get proper risk:reward.

Click image for original size


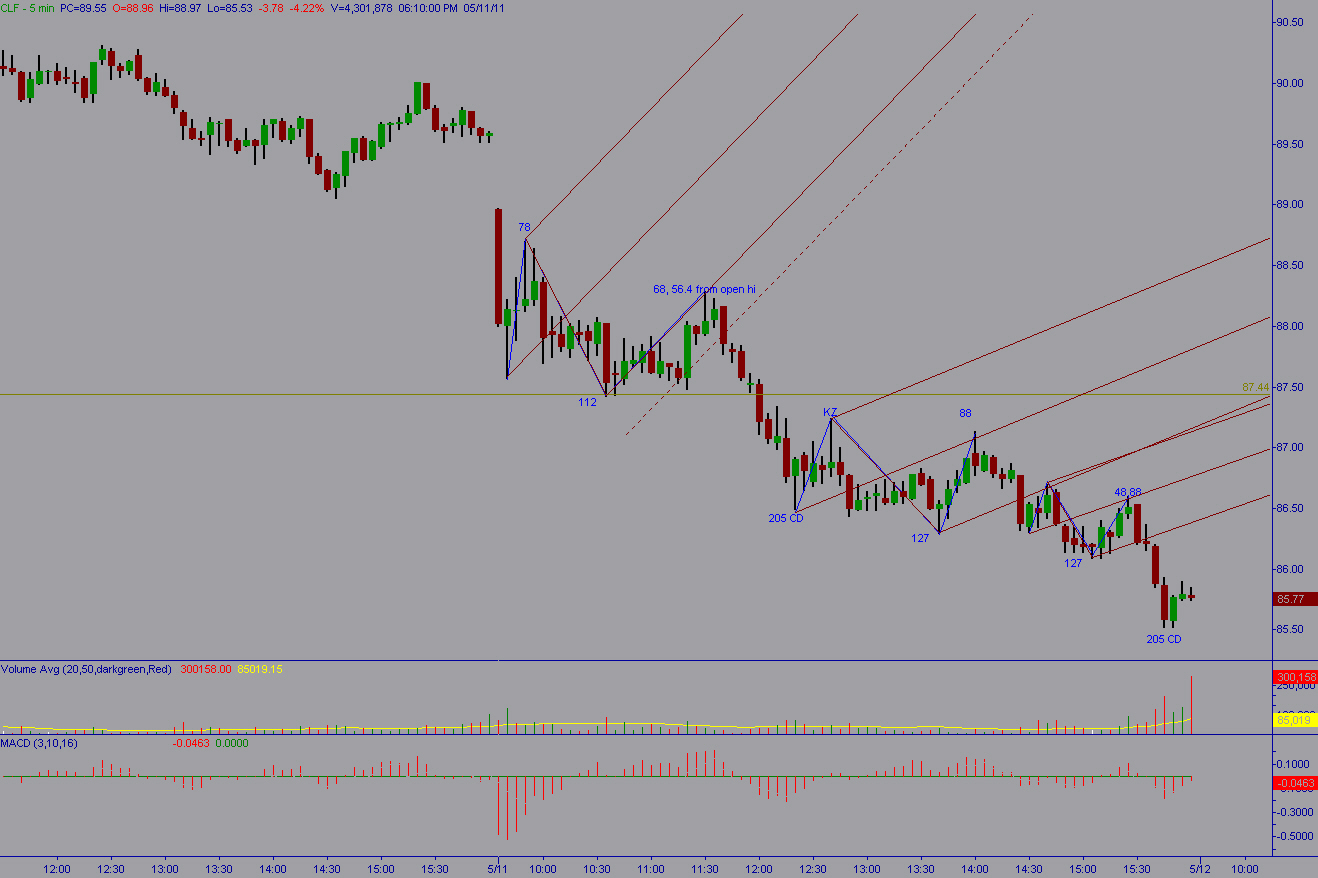
But you ask, where are the lines at the fibs (you need pattern, fib, lines after all). I drew a MLS at the abc pivots to get the lines. I drew on the 1 or 2 minute but I show here on 5.


Click image for original size


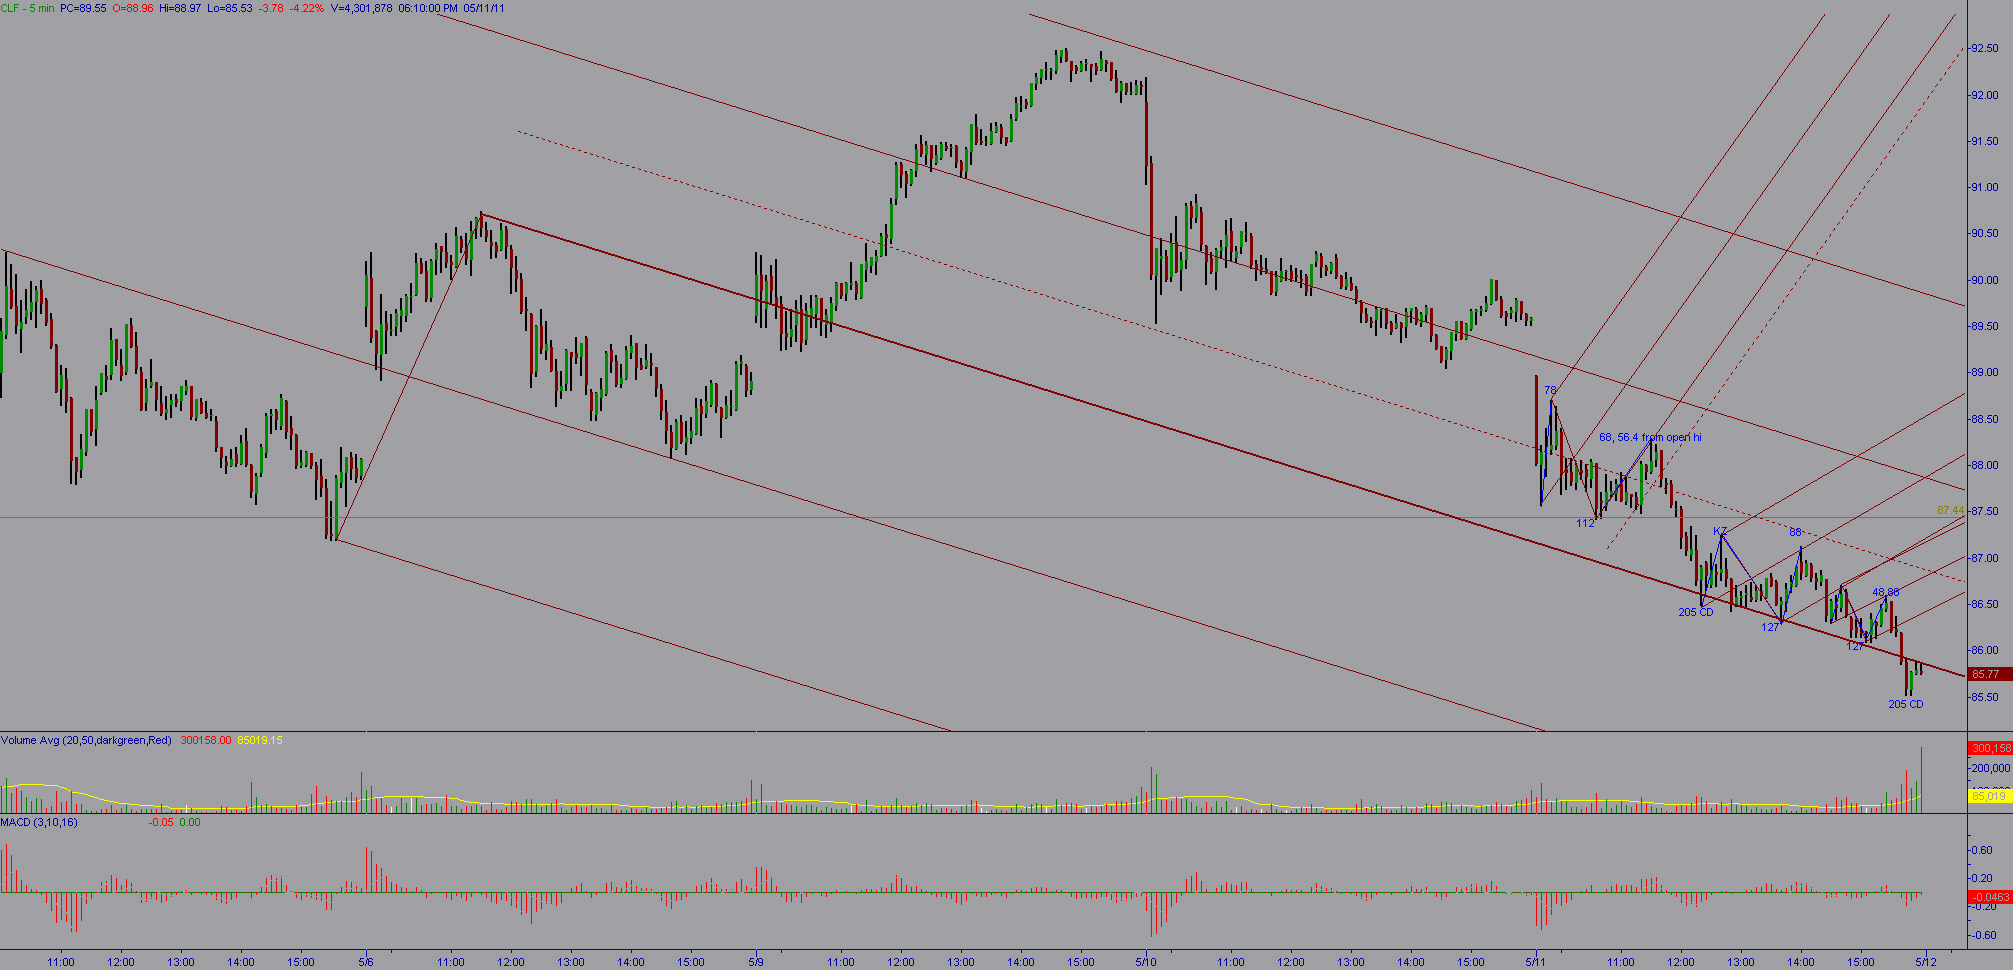
After the fact, I found a larger set to touch some of the swing lows. And I did find an adjusted set to touch some of the swing highs but I don't show it since it felt too much like curve fitting.

Click image for original size
RA
rat89
Rep: 0
Posts: 7,015
great work tx, very cool.
RA
rat89
Rep: 0
Posts: 7,015
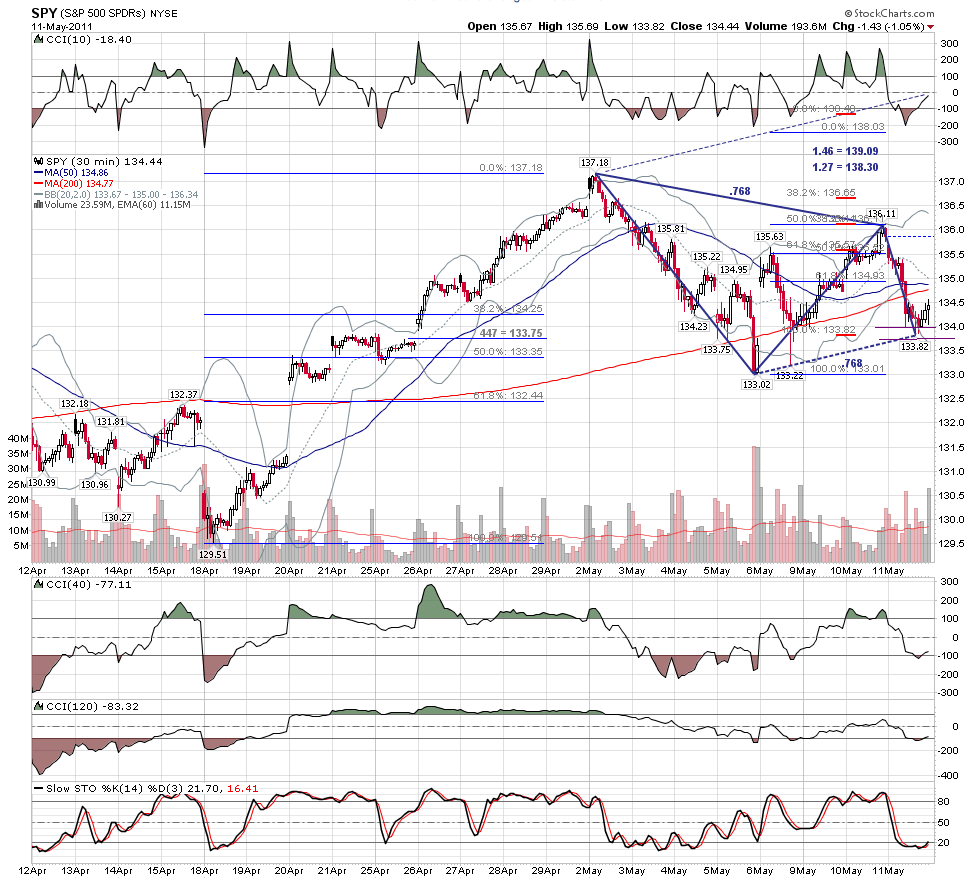
I'm still keeping an eye out for a potential bearish 5 pt in the early stages as it evolves and either sets up or evaporates. so far this is where it is at the moment, assuming that 133.74 doesn't get taken out to the downside. that would be the .768. coincidentally it would also be 447 of the move up off 129.51 and with a couple of cents of 1.128 of the bounce (so far) off today's low.

so, is it possible that if that area holds we get a strong enough move up to a new high and a bearish 5 pt? it seems like it would be a butterfly at this point.

another interesting think i'm seeing is this:
137.18 - 133.02 = 886 at 136.71
136.11 - 133.82 = 1.27 at 136.73

or maybe it just keeps going down, but that just seems too easy somehow...


Click image for original size
JI
jimkane
Rep: 3,058
Posts: 33,089
And now Druckenmiller joins Gross and Grantham. Maybe it just took one person (Gross) to say out loud the Emperor has no clothes? At some point the bond vigilantes will overwhelm the Fed. Maybe not yet, but some day...

http://www.zerohedge.com/article/druckenmiller-calls-out-treasury-ponzi-scheme-its-not-free-market-its-not-clean-market-ident