ES 05-09
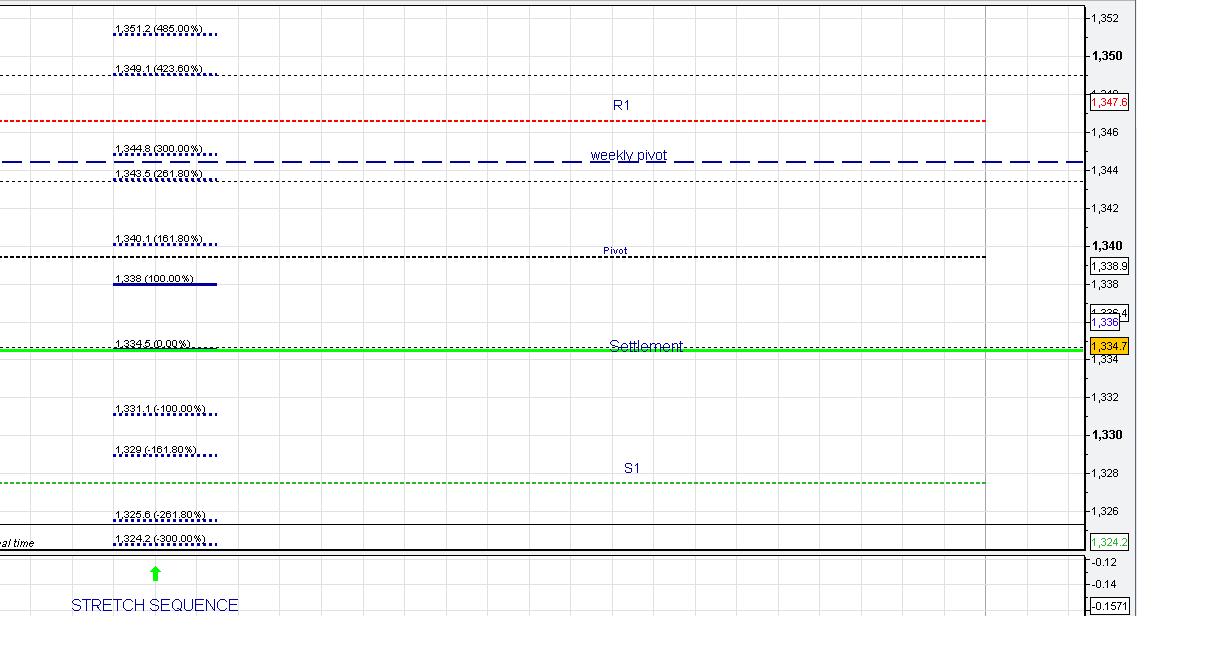
Some numbers for Monday. I expect the bulls won last week, if commodities can drop 10% and stocks dont sell off big time then you have to be with the bulls. Any moves down to 1329 and 1326 should be counter trend to be bought, no bias though intra day assume anything can happen
I just used standard pivots from chart software, I notice they are a little different from the ones posted on the daily notes here. Interested in anyones thoughts on the various pivot/R1/S1 calcs that people use?
I have added the stretch sequence on the left. All the numbers are fibs off the stretch and stretch 161 , so 423 and 485 are (stretchX161) X 2.61 and 3. I thought it was better to put them in one sequence as some of the numbers overlap.
Click image for original size
shorted above 45.25...( above O/N highs)...target is 43.75 and 42.50.......
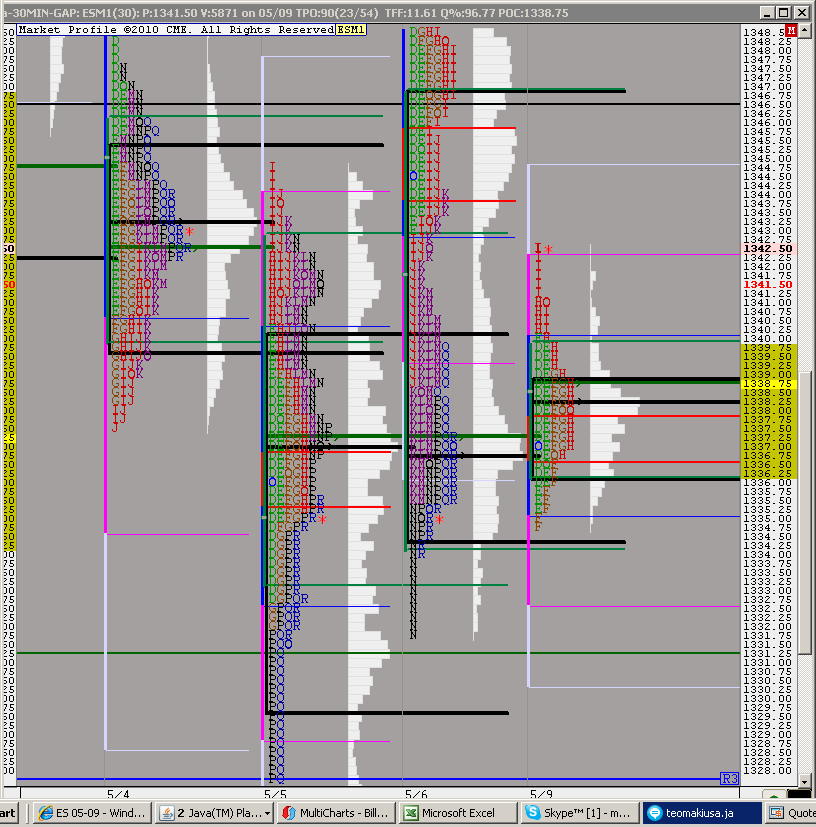
LEvels update
Click image for original size
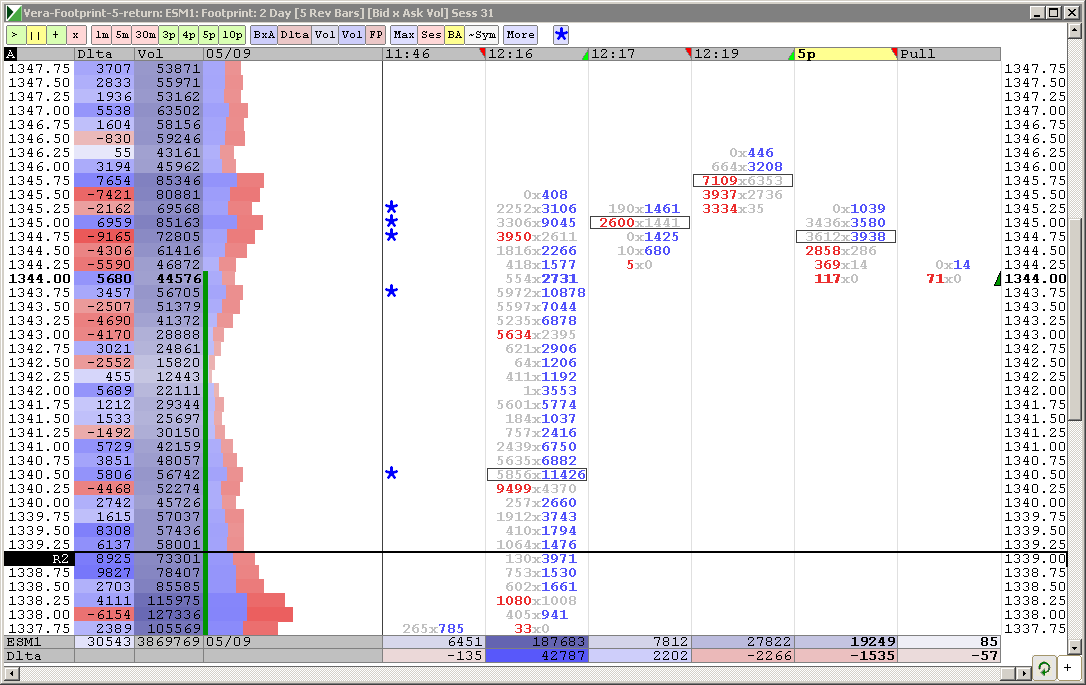
it will be interesting to see what happens once LORN stops buying the 42.50 area....
That one was just for you Bruce.
Originally posted by BruceM
it will be interesting to see what happens once LORN stops buying the 42.50 area....
Emini Day Trading /
Daily Notes /
Forecast /
Economic Events /
Search /
Terms and Conditions /
Disclaimer /
Books /
Online Books /
Site Map /
Contact /
Privacy Policy /
Links /
About /
Day Trading Forum /
Investment Calculators /
Pivot Point Calculator /
Market Profile Generator /
Fibonacci Calculator /
Mailing List /
Advertise Here /
Articles /
Financial Terms /
Brokers /
Software /
Holidays /
Stock Split Calendar /
Mortgage Calculator /
Donate
Copyright © 2004-2023, MyPivots. All rights reserved.
Copyright © 2004-2023, MyPivots. All rights reserved.