YMM1, (3, -1), profitable Strategy, 2.618% profitable
Hi,
Basis YMM1 (June e-mni $5 Dow futures):
Trading from unchanged, 12631, and fading the first move, i.e., -1 of (3, -1):
12631 - the Stretch calculation = 12631 - 27 = 12604 (12601 = low at 21:52PDT).
12631 - 27 = 12604, representing the fade, i.e., -1 of (3, -1)
12604 + 27 + 27 + 27 = 12685 (high = 12692 (12694 = high at 07:01PDT)
This completes the 3 of the (3, -1) formula.
Below you'll find a corrolating 2.618% entry level.
Measuring from the 9 May high, 12677 - 2.618 of the 10 May Stretch = 12677 - 70 = 12607. 12601 = low (21:52PDT)
how do you know when to look for 1x stretch or 1.618x the stretch to fade the initial move from settlement price? today you mentioned 1x the stretch as a succesful fade of the first move and on may 5 (or 6th, don't recall) you highlighted the 1.618x of the stretch as a fade to the first move from the settlement price
i can see how after the fact one can choose whatever fits the price action best but the catch is how to know which one to use live.
i hope you see this post and can reply to it
thanks for your help
i can see how after the fact one can choose whatever fits the price action best but the catch is how to know which one to use live.
i hope you see this post and can reply to it
thanks for your help
Ayn, you takes your chances. I'm ignoring X1 for now and sticking with X1.618 and X2.618. You can use the method for other instruments, USDGBP and USDCAD had some great X2.618 trades today in forex.
The expection should not be to always expect a 1,3 move, there are plenty of trades off a 1.618/2.618 for 40 to 80 pips, which maybe more like a 62% retracement intraday.
The expection should not be to always expect a 1,3 move, there are plenty of trades off a 1.618/2.618 for 40 to 80 pips, which maybe more like a 62% retracement intraday.
silverharp, do you trade the fib numbers of the stretch just to fade the initial move as hunter does or do you use them throughout the day to trade of swing lows/highs ? thanks for your response btw
Ayn, I've tended not to look for the fade in particular, I treat it like a fib tool but off settlement.
so you just draw them in your chart according to settlement price and use them over and over during the day combined with fib projections and so on (off swings) ?
Yep 161 261 300 425 and 485. my tolerence is about 4 dow points or half an S&P point.
what do you mean by tolerance?
Hi Ayn,
Thanks for posting your shared mutual interests. I do appreciate your curiousity.
Again, my posts focus on the e-mini $5 Dow futures, only.
Ya'll ... let's clear this up. The strategy CONTINUES TO REPEAT, e.g., the 2.618% of the Stretch reversals, and more often than you post that it doesn't work in REAL TIME.
Other www.mypivots.com forum members have replied to me with similar results in the $5 Dow futures and in other markets, including currency markets.
"Don't take counsel from your own fears." Stonewall Jackson.
If you're not sure how to make a baby, reverse engineer from the beginning. Look for the last exit (or ... the last two 2.618% of the Stretch price reversals), and enter.
Fading the first move has been a REAL TIME tried, tested and viable trading strategy these past 20+ years. You're not the first here at www.mypivots.com, to assert that it's an after the fact strategy. If you are not willing to risk a dozen e-mini $5 Dow points, intra-day trading $5 Dow futures may not be right for you. Intra-day $5 Dow margin for the $5 Dow futures is (approximately) $672; and inter-day margin for the $5 Dow futures is approximately $6700. These strategies are risk management tools that I apply to intra-day trading e-mini $5 Dow futures.
1.) The 'fade the first move (strategy)' by either the Stretch, or 1.618% of the Stretch is a tried, tested and viable real time trading strategy. The price prints support this statement. Risking several points is a part of trading. Choose your entry with an eye to the previous 2.618% reversal and project a 2.618% reversal from there. From the 9 May high, 12677 - 2.618% ... read below.
2.) Fading price moves that approach 2.618% of the Stretch calculations tend to reverse and corrolate to the approximate range of the 3 in the (3, -1) formula.
Question: 'How do I know which to choose... the Stretch? or 1.618% of the Stretch?
Let's start with the 2.618% of the Stretch reversals, in part because they happen more often, and are a valuable reversal tool. You may want to focus entirely on the 2.618% of the Stretch reversals. They tend to balance with the (3, -1) formula, i.e., the 3 of the (3, -1).
Today, like many other days, I chose a late B session price rotation high (or low, but in this case just happened to be the daily range high... you're looking for a 2.618% reversal rhythm. Why from 12677? After reversing +105 points from the 12572 low 07:42PDT 9 May, the tradeable probabilities that fading a 2.618% move increased significantly, even if the 12572 + 78 (2.618% of the Stretch for 9 May) = 12650 was 27 points below (+105 pts from 12572 to 12677) the actual high print, 12677 (11:42PDT). 12677 - 70 = 12607 targeted reversal. THIS IS REAL TIME. This strategy produced profits for myself, as well as a several other www.mypivots.com forum members. (That's a jab at all the readers who say that this strategy is not a viable real time strategy.) The strategy is to fade a 2.618% of the Stretch price move as measured from the previous 2.618% of the Stretch price move that could have been faded. So that shows you how to get into rhythm. Look for a rotation to complete. Wait for a corrolation, example: The 9 May late B session sell off from the high, 12677, into the settlement, 12631, and follow through into the next A session... 12677 - 2.618% of the Stretch = 12677 - 70 = 12607 (10 May 2.618% of the Stretch = 70). That 12607 closely corrolated to the previous settlement, 12631 - the Stretch calculation for 10 May, ... 12631 - 27 = 12604. Given that you risked 27 points when you faded the 2.618% of the Stretch reversal (that's usually the most you'll ever 'have to' risk fading a 2.618%) risking sixteen points betweeen the 10 May Stretch calculation, 27 (12631-27= 12604) and 1.618% (12631 - 43 = 12588) justifies the trade entry.
You can see how the -2.618% of the 10 May Stretch calculation closely corrolated to the (3, -1) formula with respect to fading the Stretch calculation and/or the Fibonacci of the Stretch calculations. In that it indicates a fade at the first price move from the previous settlement that finds a price measurement similar to the 2.618% reversal.
Silver, ... four e-mini $5 Dow points or 1/2 an ES point? My fills are spread across four points. In the thinly traded A session hours, a one lot can move the e-mini $5 Dow three points. The industry (professional money managers) average is a 3.2 - 1 reward to risk ratio.
Ayn, No, I don't focus on the (3, -1) formula as a golden egg. It's a trading tool that can compliment, or conflict with other tools. I don't apply stochastics, histograms, nor nearly any of the other price following tools. If I can't lead it to the water, I'm concerned. If I'm not getting in early, that means that someone else already has, which defines that I have poor positioning in the trading range. I tend to fade the 2.618% moves later in the day with a target exit a little less than the Stretch and a little less than 1.618% of the Stretch. The (3, -1) formula helps me project early entry levels and a pattern to develop later in the day; but later in the day I am usually outside having fun. You should try it. Fun. lol
Ayn, No, I don't focus on the (3, -1) formula as a golden egg. It's a trading tool that can compliment, or conflict with other tools. I don't apply stochastics, histograms, nor nearly any of the other price following tools. If I can't lead it to the water, I'm concerned. If I'm not getting in early, that means that someone else already has, which defines that I have poor positioning in the trading range. I tend to fade the 2.618% moves later in the day with a target exit a little less than the Stretch and a little less than 1.618% of the Stretch. The (3, -1) formula helps me project early entry levels and a pattern to develop later in the day; but later in the day I am usually outside having fun. You should try it. Fun. lol
by 4 dow points I mean I wouldnt trade a high/low based on the stretch number unless it was within 4 points of it, closer the better.
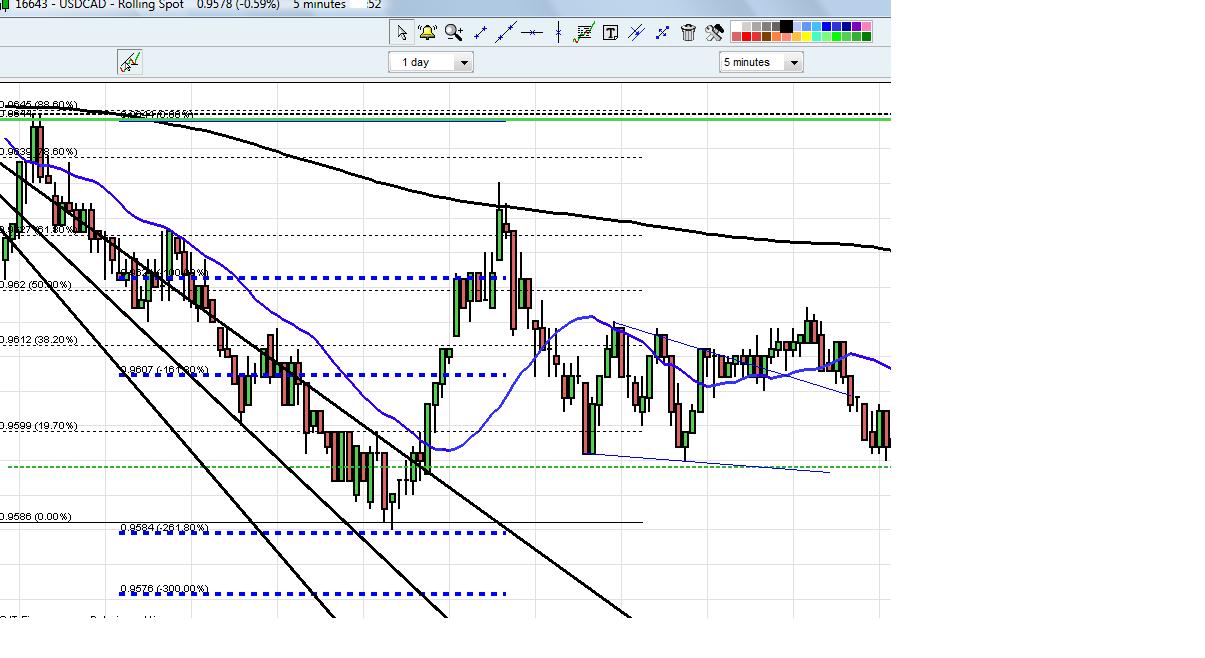
Here is a trade I did today USDCAD, I calculated my own stretch as this is the spot, I bought the morning low based on the 261 (to 1 point)and a Fib fan, at the time I treated it as a counter trend move.
Here is a trade I did today USDCAD, I calculated my own stretch as this is the spot, I bought the morning low based on the 261 (to 1 point)and a Fib fan, at the time I treated it as a counter trend move.
Click image for original size
was hoping the es would go to its 1.618 at the open which would have likely pushed ym to its 2.618 stretch...that would have been the ideal scenario for me to get long...
Emini Day Trading /
Daily Notes /
Forecast /
Economic Events /
Search /
Terms and Conditions /
Disclaimer /
Books /
Online Books /
Site Map /
Contact /
Privacy Policy /
Links /
About /
Day Trading Forum /
Investment Calculators /
Pivot Point Calculator /
Market Profile Generator /
Fibonacci Calculator /
Mailing List /
Advertise Here /
Articles /
Financial Terms /
Brokers /
Software /
Holidays /
Stock Split Calendar /
Mortgage Calculator /
Donate
Copyright © 2004-2023, MyPivots. All rights reserved.
Copyright © 2004-2023, MyPivots. All rights reserved.