YMM1, (3, -1), profitable Strategy, 2.618% profitable
Hi,
Basis YMM1 (June e-mni $5 Dow futures):
Trading from unchanged, 12631, and fading the first move, i.e., -1 of (3, -1):
12631 - the Stretch calculation = 12631 - 27 = 12604 (12601 = low at 21:52PDT).
12631 - 27 = 12604, representing the fade, i.e., -1 of (3, -1)
12604 + 27 + 27 + 27 = 12685 (high = 12692 (12694 = high at 07:01PDT)
This completes the 3 of the (3, -1) formula.
Below you'll find a corrolating 2.618% entry level.
Measuring from the 9 May high, 12677 - 2.618 of the 10 May Stretch = 12677 - 70 = 12607. 12601 = low (21:52PDT)
thanks grednfer....one thing i am confused about is what do you compare the ema against ? it is not clear to me how your machine draws a conclusion regarding momentum from just looking a single ema indicator with a 4 or 5 input...
sorry if i misunderstood your explanation
metric
sorry if i misunderstood your explanation
metric
Originally posted by grednfer
Hunter....yeah definitely toppy...also May after a two year rally from 6600......
They really pounded NQ towards the close, much more than YM.
Ayn,
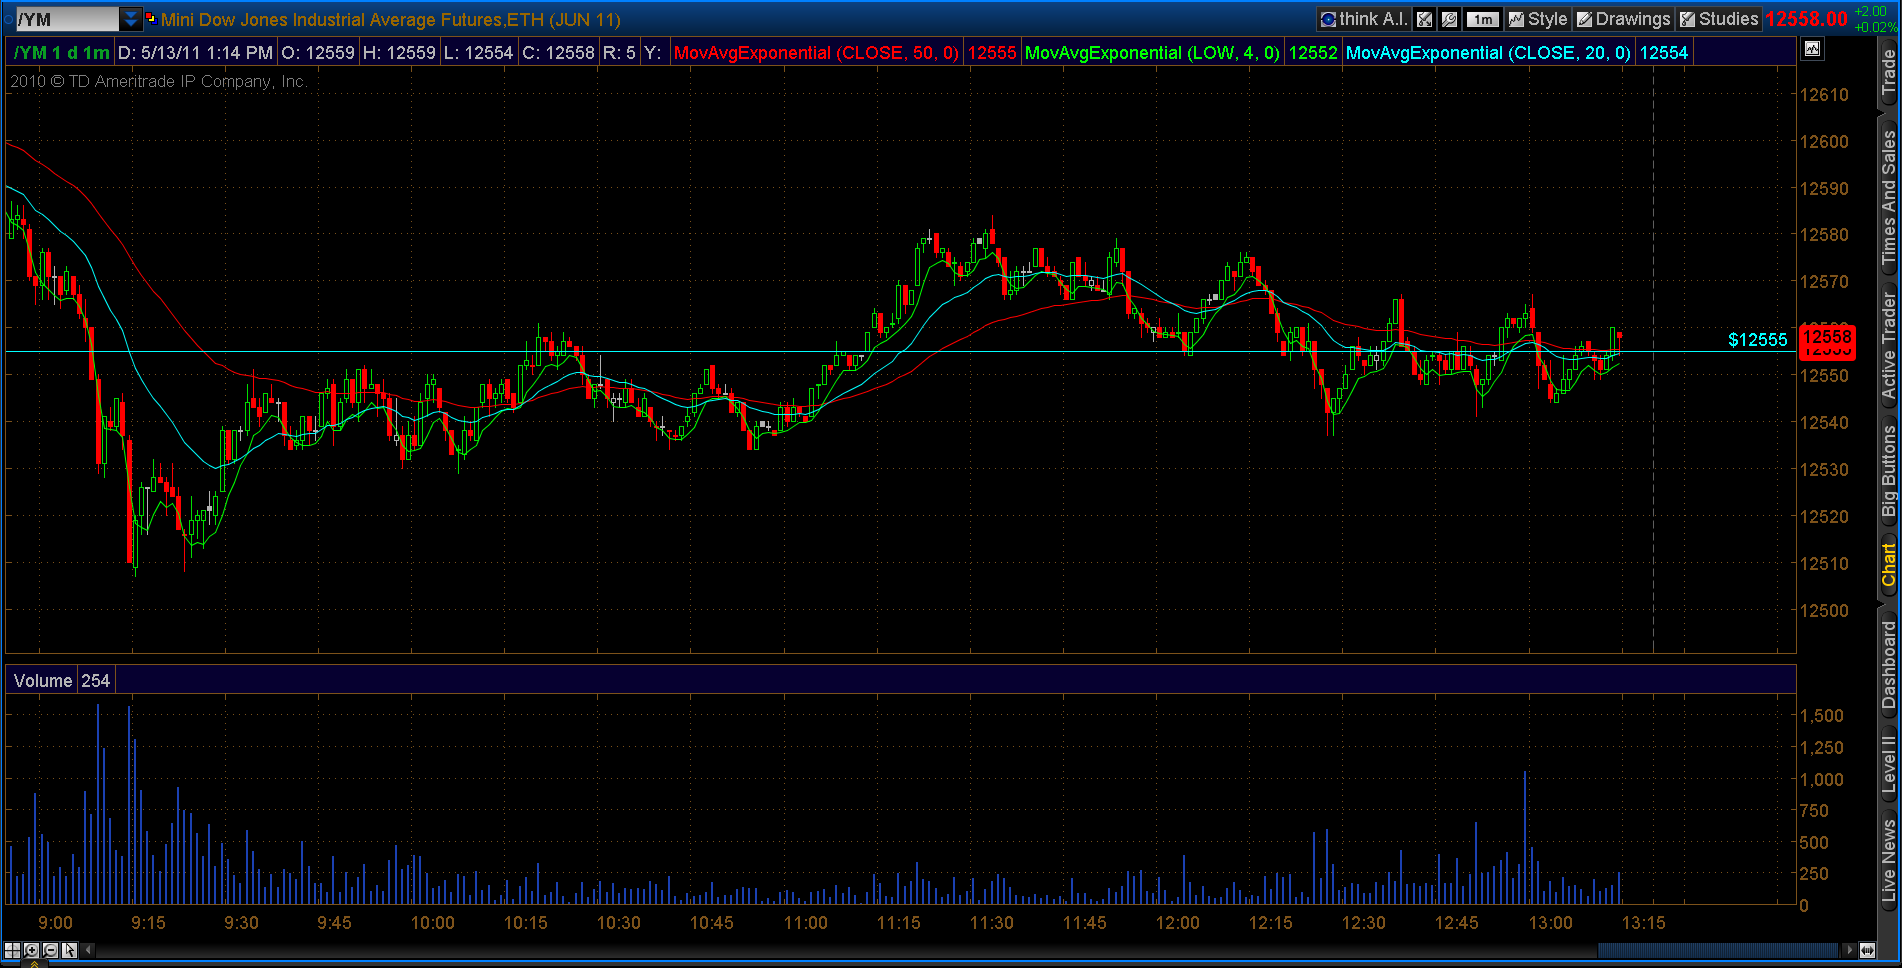
How do I define momentum? Oh boy thats the BIG question. The theme of this project is "return to simplicity"....so the YM machine is only trading the Hunter Algo and the pivots(and 50% of the pivots).
So while I have more complex rules for assessing momo, right now I'm just using an EMA, probably comparable to the 4 or 5 bar on the 1M chart.....No stops....but it does have exit criteria if momentum reverses........the 555 trade yielded nothing.
Its all a work in progress....but I like the pivots and I like the hunter fade thing......
Have a good week-end.
OK.....here is an example.....on the left you see the 555 pivot being hit, but the mo (Green Line) crashes right down through it.....so no buy there.
Moving to right....you see 1 failed attempt and in the middle you see nice upward mo crossing above the pivot. You can see a little volume pop and a price jump at the cross-over...indicating there are others running this same algo. This is a good MO trade on the S1 Level....it was just slow so I was ambivilent about it. And if you watch the price after that it returned for a backtest but then...it did nothing except do an equilibrium dance about the pivot.....BOOOOOOOOOO!
Look at those volume spikes at the 510 level......STOP CITY! That was a good trade but I don't bottom fish....I trade the mo......
Hope that helps
Click image for original size
Hunter sorry if I misspoke about your posts. I believe what you say about posting times, no need to check. Please accept my sincere apologies.
RB
RB
thanks very much for the explanation grednfer !
This a good thread. I had a question about the rules that apply to the calculation as the rules imo are as important as the calculation ..
Can't have one without the other ..
The answer was in this thread...
Can't have one without the other ..
The answer was in this thread...
I wanted to qualify a statement I made above.....about bottom fishing....
Given the velocity with which the price blew down through the S1 level on Friday......I think historical areas of support or resistance are just as good if not better than pivots....like the 504-518 area......
Sometimes I have to fight the expection of digital perfection.
Given the velocity with which the price blew down through the S1 level on Friday......I think historical areas of support or resistance are just as good if not better than pivots....like the 504-518 area......
Sometimes I have to fight the expection of digital perfection.
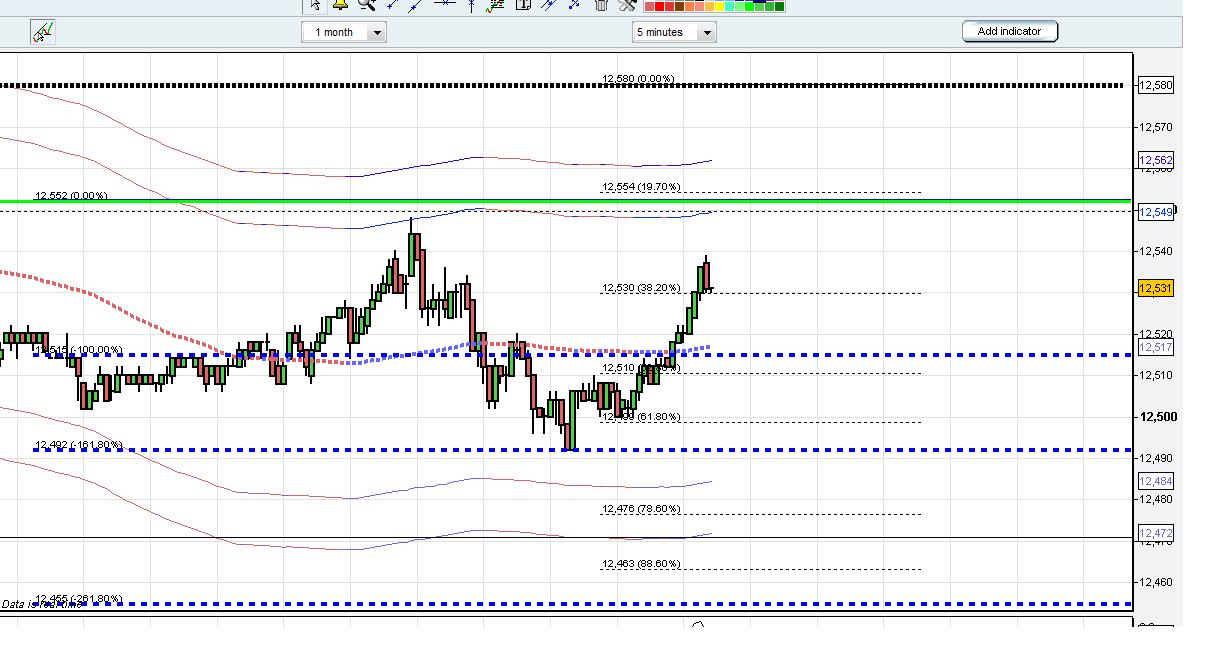
went long here at 12500 after the bounce on the 161, tyring not to be a scalper so unless the action looks weak at settlement I'll try hang on for the the morning session. given that we had a decent lower low after Friday, hopefully some sort of short term bottom is in.
Click image for original size
we are on the same page...i took the long yesterday evening (paper trade though) at 496, the level of my 1.618 % (i think your close is slightly off, hence yielding different stretch numbers) and it was unwound at 446 while i was sleeping. Wish it had been a live trade !
the method calls for target to 3xstretch. so the target should be 496+111=11607. so cograts, you are still in the paper trade!!
Originally posted by ayn
we are on the same page...i took the long yesterday evening (paper trade though) at 496, the level of my 1.618 % (i think your close is slightly off, hence yielding different stretch numbers) and it was unwound at 446 while i was sleeping. Wish it had been a live trade !
you can go ahead and target whatever you want, and the same applies to me ! i had decent resistance penciled in the 40-50 area so thought it was wise to target somewhere in that area...i paper trade the same way i would live trade this strategy and to me a 50 pt profit given a 20-30 pt stop is not a bad recurring strategy to have. You do whatever fits your profile, but of course you knew that already
Originally posted by insyte
the method calls for target to 3xstretch. so the target should be 496+111=11607. so cograts, you are still in the paper trade!!
Originally posted by ayn
we are on the same page...i took the long yesterday evening (paper trade though) at 496, the level of my 1.618 % (i think your close is slightly off, hence yielding different stretch numbers) and it was unwound at 446 while i was sleeping. Wish it had been a live trade !
was hoping the es would go to its 1.618 at the open which would have likely pushed ym to its 2.618 stretch...that would have been the ideal scenario for me to get long...
Emini Day Trading /
Daily Notes /
Forecast /
Economic Events /
Search /
Terms and Conditions /
Disclaimer /
Books /
Online Books /
Site Map /
Contact /
Privacy Policy /
Links /
About /
Day Trading Forum /
Investment Calculators /
Pivot Point Calculator /
Market Profile Generator /
Fibonacci Calculator /
Mailing List /
Advertise Here /
Articles /
Financial Terms /
Brokers /
Software /
Holidays /
Stock Split Calendar /
Mortgage Calculator /
Donate
Copyright © 2004-2023, MyPivots. All rights reserved.
Copyright © 2004-2023, MyPivots. All rights reserved.