ES 5-12-2011
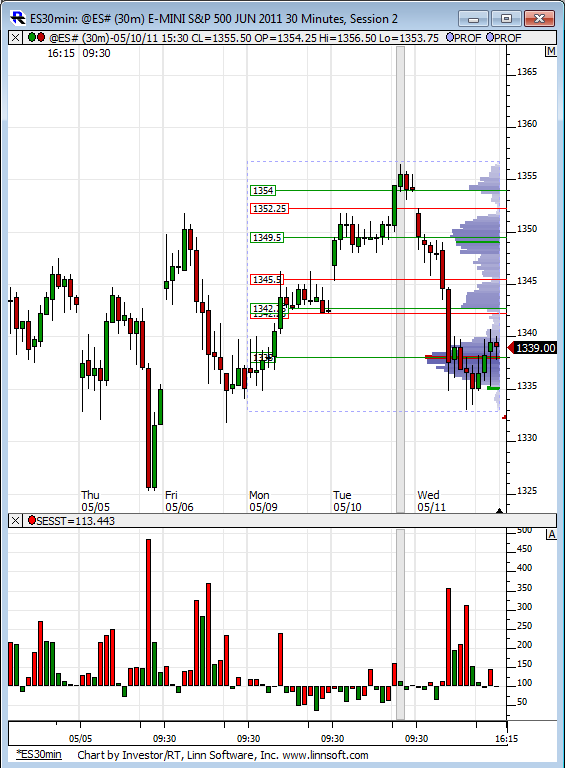
Developing RTH volume profile for the week. Notice relative volume on the bottom increases as prices drop and decreases as prices rebound. The profile itself is interesting, kind of like clumps with not much in between.
Click image for original size
starting new longs at 29.25...this will overall be a smaller campaign as don't want to give back $$$$...volume lighter on drive down...we need $ticks tio improve if we will eventually get our 37.50 retest today
taking something off at 32.50 and holding two.....will try to hold these for new highs....but still can't expect trends yet...
gap in data at 32...taking one off at 33.75 as I expect to go back down...holding one
flat at 35....just not sure now with that gap there
that was a perfect test of the OR low....no good read to try the short and that gap is a least favorite target as mentioned yesterday...
Bruce,
I agree with you and work with a concept of what I expect to happen. I find myself to be a much better analyst than a trader. ;] Each morning, I physically write down what I think is going to happen at the open. Often, I am pretty accurate, but my ability to trade it is what I struggle at.
For example, I was expecting the rally that happened off the S1 area (1328.50) to find resistance at 1336.25-36.50 (bottom of my VA and 52.8% of S1 to PP), then back down to lows for another rally to the gap fill (1339.75) (with res expected at that 36.25 again). Res expected there due to it being the O/N high, the top of my VA, and 0.786 of S1 to PP. Above that area and I have some other levels to watch out for.
But, as usual, I didn't take the short and I was shaken out of that 29.75 that I was holding, so I am missing this rally. :]
Daniel
This is where a lot of traders get to. Analysis comes way before execution. Execution, imo, simply can't be taught but must be learned through years of immersion into the daily rigors of trading. Practice, practice and more practice. So little practice is done in trading, most would be traders read a few books, take a seminar or two and expect to be millionaires....
All the best and keep at it my friend.
All the best and keep at it my friend.
Originally posted by neoikon
Bruce,
I agree with you and work with a concept of what I expect to happen. I find myself to be a much better analyst than a trader. ;] Each morning, I physically write down what I think is going to happen at the open. Often, I am pretty accurate, but my ability to trade it is what I struggle at.
Really nice trading BruceM. Preciate you posting. Interesting your comments on planning your expectations. I was taught/told to never add to a so called "loosing" trade. And becuase of that went through a period of heavy losses due to too tight of stops. It's harder psychologically to get back into a trade once stopped out then it is to manage a trade based on higher probability moves in the market that have their basis in known support/resistance areas, whether they are based on volume profile, fib numbers, pivot points or whatever. Now I scale in and scale out and am finally profitable.
Originally posted by Lorn
This is where a lot of traders get to. Analysis comes way before execution. Execution, imo, simply can't be taught but must be learned through years of immersion into the daily rigors of trading. Practice, practice and more practice. So little practice is done in trading, most would be traders read a few books, take a seminar or two and expect to be millionaires....
All the best and keep at it my friend.
Thanks, yeah, I'm definitely grounded and not looking to be a millionaire or for it to be easy. My first step is to merely cover the bills. ;] I've been hitting this full-time for quite a long time now and have written 100+ indicators, scripts, alerts over that time (for eSignal). (I was a software developer in a past life) Feels like I keep butting my head against the wall looking for that transition from analyst to money making trader.
(Decision point in the market, right here, IMHO)
Daniel
Like with most sup/res, they aren't always exact. Sometimes it comes in a little short and looks like a 50%, sometimes it goes a little long and gets closer to the 61.8%. But in all, I feel more comfortable with the 52.8.
BUT, you have to make sure you are measuring from the right direction. 52.8 in one direction is the 47.2 in the other direction. Using today's data, measuring from the PP up to R1, you see support at that 52.8 level. If I had measured from R1 to PP, then the level would be too high.

I have a script that auto-calcs the fib levels between the pivot levels. For example, if I double click in between PP and R1 (but closer to R1) then the levels are calculated originating from R1. If I click closer to PP, then they are outputted originating from PP, etc. Great time saver.
Can you expand more on what you mean about "combining momentum with the pivots"?
Daniel
BUT, you have to make sure you are measuring from the right direction. 52.8 in one direction is the 47.2 in the other direction. Using today's data, measuring from the PP up to R1, you see support at that 52.8 level. If I had measured from R1 to PP, then the level would be too high.
I have a script that auto-calcs the fib levels between the pivot levels. For example, if I double click in between PP and R1 (but closer to R1) then the levels are calculated originating from R1. If I click closer to PP, then they are outputted originating from PP, etc. Great time saver.
Can you expand more on what you mean about "combining momentum with the pivots"?
Daniel
Originally posted by grednfer
Neo....
Its good to hear someone from the pivot site actually uses these thingees.......I have an algo background....and have only recently incorporated a pivots (go figure right?).....I really like it.....Simple, easy to calc and visualize and TEST!, yet dynamic.....
I've haven't tried the 52% factor, but I use 50% just like another pivot.......it pops up alot.
Like tonight....NQ AH top is 2308=((R1-PP)*.5)+PP......its works alot....
I really like combining momentum with the pivots....but I have to adjust the numbers so I get movement through the pivot....I haven't perfected that yet(need more data).....Its just a fixed adjustment....on ES it seems to be 1.5-2 points....
Very Cool.....
Emini Day Trading /
Daily Notes /
Forecast /
Economic Events /
Search /
Terms and Conditions /
Disclaimer /
Books /
Online Books /
Site Map /
Contact /
Privacy Policy /
Links /
About /
Day Trading Forum /
Investment Calculators /
Pivot Point Calculator /
Market Profile Generator /
Fibonacci Calculator /
Mailing List /
Advertise Here /
Articles /
Financial Terms /
Brokers /
Software /
Holidays /
Stock Split Calendar /
Mortgage Calculator /
Donate
Copyright © 2004-2023, MyPivots. All rights reserved.
Copyright © 2004-2023, MyPivots. All rights reserved.