ES Day Trading 5-24-2011
Thanks Paul...Most breakouts fail the first time.....meaning 80% will NOT just blow through a point without some kind of retest..so my constant effort is ALWAYS trying to fiqure out that 20 % that just run and don't come back.....a constant effort and we can lose a lot of money on TRUE breakouts....
I think if we can hold back any rallies into 18.50 ( low volume there) and 19.75 ( high volume there) then we have a chance at some more selling today..
I think if we can hold back any rallies into 18.50 ( low volume there) and 19.75 ( high volume there) then we have a chance at some more selling today..
Originally posted by PAUL9
Congrats to you, Bruce. Nice trading.
In the pre-market, I was totally convinced (dangerous thing) that there should be a short squeeze today.
and I don't think I was rationalizing the overnight PA
overnight
1) retested prior RTH swing Low and uncovered buyers.
2) exceeded yesterday's RTH H and uncovered some sellers...BUT
3) retraced only about 50% of the run from early overnight low to current overnight H
I thought if the swing low held as support, an RTH move above overnight H plus a couple of ticks had a great chance at igniting a squeeze.
(50% retracement of the RTH L to H is = 1316.75, actual print low on retracement was 1316.50 near 7:30am)
but I also monitor the NQ, and in the RTH, the NQ was much weaker than the ES. I didn't like the action, so I didn't trade the fakepout breakout.
I'm not upset about mis-diagnosing the overnight, I'm happy I didn't buy the RTH high! ha ha ha.
Originally posted by neoikon
15.75 is the gap fill, watching for a re-test. (if we go above 21.25 first, careful of lower)
My thought this morning was that we wanted to get up to 1324 area, then possibly higher. In order for that to happen, I was hoping to see the gap fill happen right after the open, this would finish that job, then entice more buyers to go higher.
The fact we popped up higher than the O/N (higher than 21.25) before the gap fill made me feel like we used up some buyers pre-maturely. Now that we have filled the daily gap, the bears gained more confidence (pulled the market down from an even higher point) and the bulls have lost some. Thus, I'm looking for O/N lows and maybe a domino down to that 1308.25 (4/19 unfilled gap and S1).
Just what I am watching till proved otherwise... There are lots of various support levels along the way.
that was big ole node of volume into 1315 area so I don't expect to just blow through there..I'll let you folks battle it out...
High volume areas are much better to use for targets IMHO then to initiate trdaes from......better to initiate in low volume areas and target high volume..
when we do just blow through HV areas ( big nodes of volume based on time) then it would be better to do one of two things...
1)Trade for a retest from below - so if we get under the 1315.50 and just drop then look for volume to dry up on the decline and initiate long trades for the retest back up...or
2) look for sells after we test 1315 from below...so if you miss the long trade once underneath then look for sells as close to 1315.50 as possible..
I don't know what most do in their spare trading time...for me I'm always trying to fiqure out just how much power the O/N market REALLY has over our day session...
I believe strongly in those ranges and also keep track of big volume in O/N and low volume....BUT I am not convinced as much with those measures..( O/N high and low volume) I like to see if those line up with anything...
The point is that we had SECONDARY big volume at 1314.25 in the O/N session..and so far it is the current day session low...
Just giving those who like volume something to think about....as if you really need more things to investigate..!! It never ends...the different ideas generated from market data...can drive us nuts !!!
thanks for the comments/insights Bruce and neoikon.
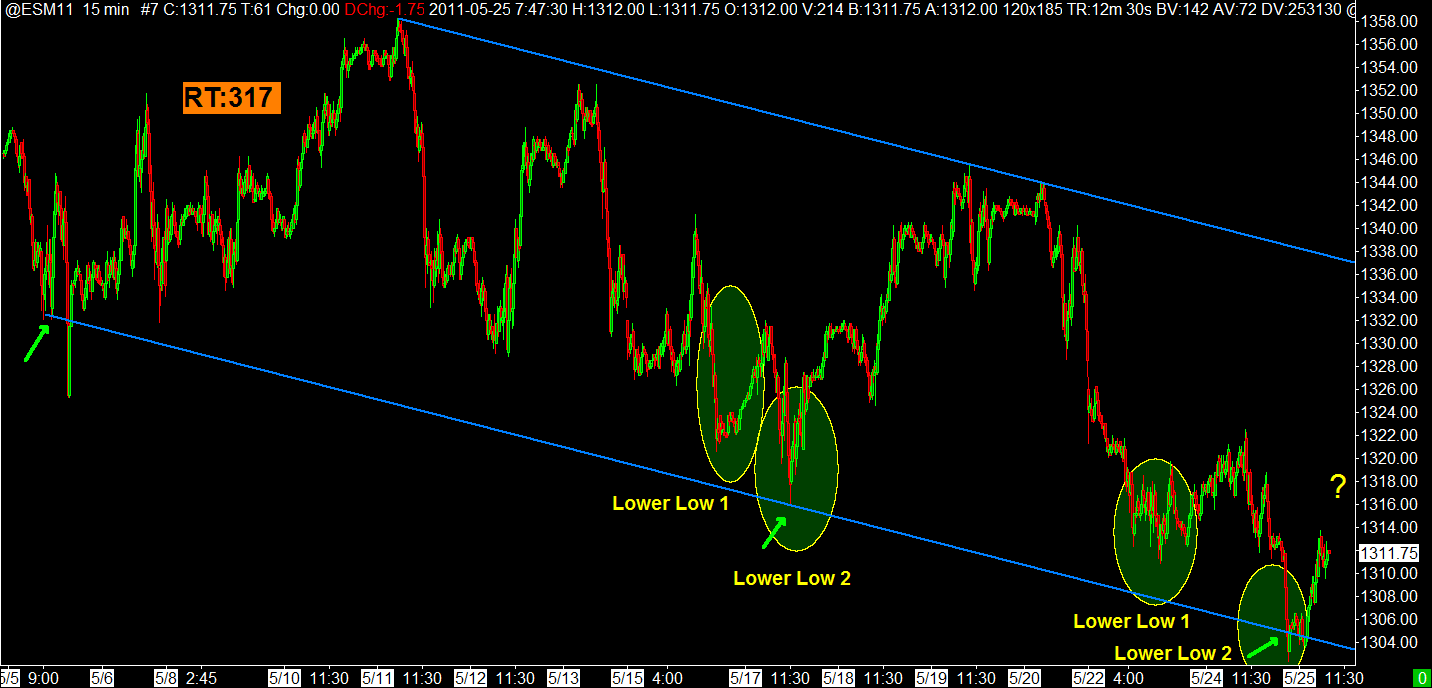
Using very basic TA of "higher highs and higher lows" to maintain an upward trend, here is some pics to go with what I was describing above.
This is what I was hoping to happen:

But the new pop after the open created a bigger job for the bulls once the gap was filled. So it's not surprising to see a larger push to the downside.

My $0.02.
This is what I was hoping to happen:
But the new pop after the open created a bigger job for the bulls once the gap was filled. So it's not surprising to see a larger push to the downside.
My $0.02.
Then, if you felt the bears had control again, some basic fibs worked out well:

NQ's have now reached their YD RTH low's. I'm watching for support evidence in the NQ's here with a possible spill over effect in the ES. If not, wouldn't be surprised to see a quick breakdown in ES.
In the same vein as Fibonacci and the Golden Mean/Ratio...
I'm not saying I believe in all this astrology stuff, but I do find this ratio very interesting... and is why I keep x.272 on my radar along with x.618.
Earth radius + Moon radius:
http://goldennumber.net/solarsys.htm
I'm not saying I believe in all this astrology stuff, but I do find this ratio very interesting... and is why I keep x.272 on my radar along with x.618.
Earth radius + Moon radius:
http://goldennumber.net/solarsys.htm
I feel like I am spamming/rambling/being-annoying, so I will shut up after this one...
Since it's on my mind, I thought I'd share this one last thing I've noticed regarding Fibonacci retracements:

Since it's on my mind, I thought I'd share this one last thing I've noticed regarding Fibonacci retracements:
You are right it should show like this.
Click image for original size
Emini Day Trading /
Daily Notes /
Forecast /
Economic Events /
Search /
Terms and Conditions /
Disclaimer /
Books /
Online Books /
Site Map /
Contact /
Privacy Policy /
Links /
About /
Day Trading Forum /
Investment Calculators /
Pivot Point Calculator /
Market Profile Generator /
Fibonacci Calculator /
Mailing List /
Advertise Here /
Articles /
Financial Terms /
Brokers /
Software /
Holidays /
Stock Split Calendar /
Mortgage Calculator /
Donate
Copyright © 2004-2023, MyPivots. All rights reserved.
Copyright © 2004-2023, MyPivots. All rights reserved.