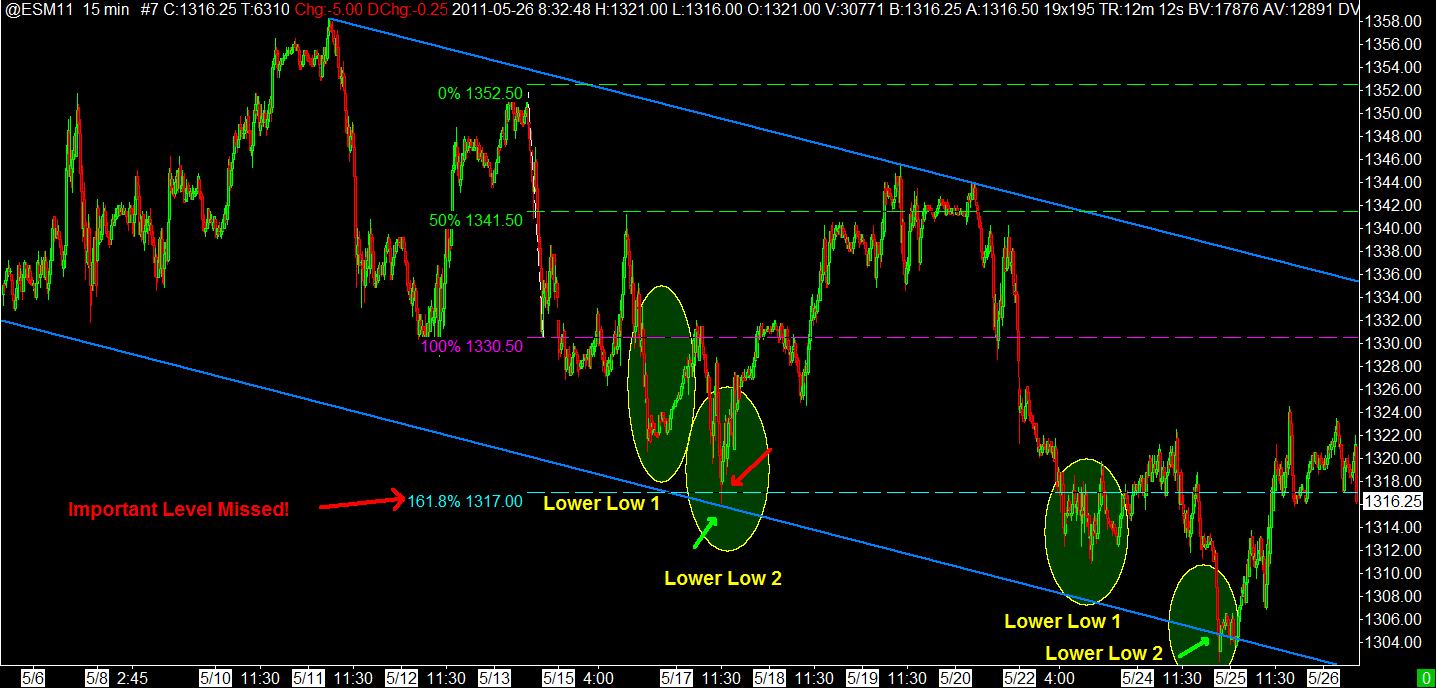
ES Day Trading 5-26-2011
one of the reasons this is small is because they will run a previous RTH range about 85 % of the time.....so only 15 % or less will be inside bars....so when we are only 2 points or so off the high from YD it is more logical to assume they will break that high...we'll see if the 15 - 16 magnet will work again or if they will finally go for the legit breakout and keep running it
Trying a short @ 1323.5 if we get there
flat at 21.75...something is off and perhaps it's me.....will look to sell higher ..closer to 24.50 if air is still below...gonna have to miss the move down if it comes now
we need to be very careful above YD highs as we are trading back into a low volume zone created by a gap...price COULD run thorugh it fast if buying is strong....and that low of that gap is 27 area...so plan on your worst case scenario when /if we get above YD highs
Not to mention last weeks close at 1327.75
Originally posted by BruceM
we need to be very careful above YD highs as we are trading back into a low volume zone created by a gap...price COULD run thorugh it fast if buying is strong....and that low of that gap is 27 area...so plan on your worst case scenario when /if we get above YD highs
29 area is 61.8 from last week High to globex low 1302.25 and 28.5 was the break down level.. fwiw..
Hit my upper target of this morning. Trying a short from 23.50.
There are a few things above this area that should offer some resistance as well:
Mon RTH 528 (1324.50)
Mon RTH 618 (1325.25)
R1 1326.50
PP-R1 786 (1324)
Yesterday's High (24.50)
Higher level Fib (1324)
Target of 1320, 0.382 retracement of this move up.
Great day so far!
There are a few things above this area that should offer some resistance as well:
Mon RTH 528 (1324.50)
Mon RTH 618 (1325.25)
R1 1326.50
PP-R1 786 (1324)
Yesterday's High (24.50)
Higher level Fib (1324)
Target of 1320, 0.382 retracement of this move up.
Great day so far!
trying from 27.25...this will be second try....all I have now is a volume divergence...
the air pocket that formed this push up formed outside of YD range ..FWIW...this is the second air pocket of the day...the first one formed inside the range of Yesterday on the hour breakout..target is 25.....just in case they want to torture me
air at 24.75...trying to get out in front of that...
No Problem......
Methodlogies tend to be frameworks and understanding the lack of of tech at the time he probably used his thumb to guesstimate the 10 day moving average......oversimplfying I'm sure.
If you look at the chart.....does it look wrong? Or does it look very very right......it looks like that every day. This morning they were just backing up truck @1312-14 level.
His base method is very accurate....even some decades later....its works on everything I've pointed it at.....
Understanding the cycle is not crtical as each day is new.....but cycle position can increase probability of the event outcome.....if you review this week you'll see a cycle low with a
1. 2.618 long Night +11 then
2. 1.618 long Morn +18 then
3. 1 long then +15
4. tomorrow......we'll see right?....down cycle could begin again....but if you short a stretch failure you'll catch the big drop.
Emini Day Trading /
Daily Notes /
Forecast /
Economic Events /
Search /
Terms and Conditions /
Disclaimer /
Books /
Online Books /
Site Map /
Contact /
Privacy Policy /
Links /
About /
Day Trading Forum /
Investment Calculators /
Pivot Point Calculator /
Market Profile Generator /
Fibonacci Calculator /
Mailing List /
Advertise Here /
Articles /
Financial Terms /
Brokers /
Software /
Holidays /
Stock Split Calendar /
Mortgage Calculator /
Donate
Copyright © 2004-2023, MyPivots. All rights reserved.
Copyright © 2004-2023, MyPivots. All rights reserved.
