ES Day Trading 5-26-2011
Click image for original size
Gap filled 1314.50
Fascinating that we saw a relative volume spike on the afternoon rally yesterday followed by less relative volume on the sell off into the close. Weekly profile is a nice looking bell curve right now, indicating neutrality. This range is gonna give up its sheets at some point...holiday weekend ahead, perhaps we wait around here until next week, or not!
Click image for original size

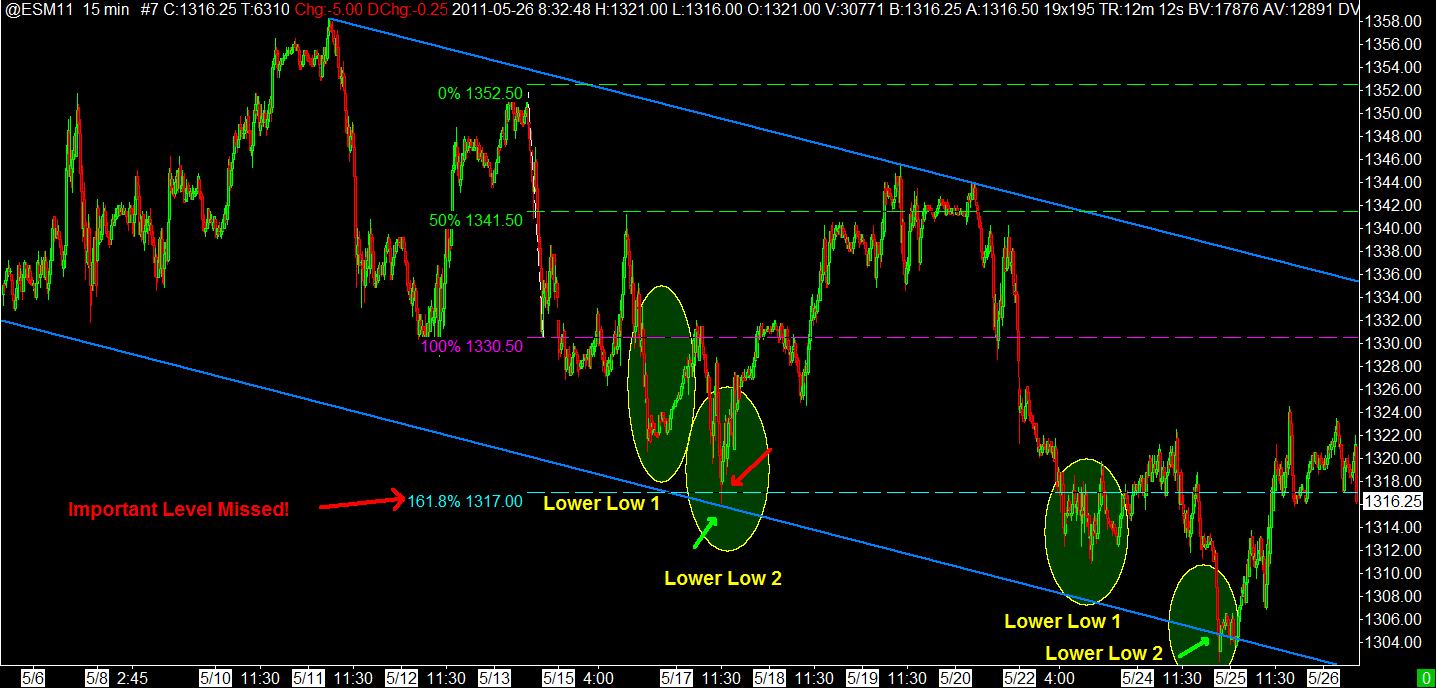
Lorn, I'm looking at the chart you posted.
You have arrow at outsized volume spike.
On the left side of the chart, I am looking at the bar 4th to the left of the vertical marker you have on date 5-19 and I see that price bar was down but with huge volume histogram painted green.
those histos, they are net ask volume minus bid volume?
I guess they must be
can these be signs of buying capitulation or even some sort of exasperated short-covering.
4th bar to left of 5-19 marker did see some upside after it, but let's face it, price didn't stay above it for long.
DO you interpret that volume spike yesterday as potential turning point? (lower)
Do you have any interpretation/observation about times in the past when this has occurred?
We are forming double bottom on the GAP. If the market breaks thought 1318.50 it will be very easy to make 1320.50 and 1322.50 at the open bell.
initial support 13.75 - 15.50 ****
18.75 HIGH volume
then gap in data from On at 21.25
23 - 25 ...oN high, YD high...key rat etc....gotta watch if we trade back up into that gap ******
1310 is next downside key
18.75 HIGH volume
then gap in data from On at 21.25
23 - 25 ...oN high, YD high...key rat etc....gotta watch if we trade back up into that gap ******
1310 is next downside key
The histograms on that chart are a relative volume of actual volume where each time period is compared to the same time period over a set number of days. I have it set to 200 days. So what you are seeing is a 100 on the scale represents normal volume over a 200 day period. So those big bars are telling you volume is expanding on a relative basis.
Its something I've been tracking only for a little while and not sure of its overall value yet but its very interesting to see if the expanding volume is coming on up bars or down bars.
Its something I've been tracking only for a little while and not sure of its overall value yet but its very interesting to see if the expanding volume is coming on up bars or down bars.
Originally posted by PAUL9
Lorn, I'm looking at the chart you posted.
You have arrow at outsized volume spike.
On the left side of the chart, I am looking at the bar 4th to the left of the vertical marker you have on date 5-19 and I see that price bar was down but with huge volume histogram painted green.
those histos, they are net ask volume minus bid volume?
I guess they must be
can these be signs of buying capitulation or even some sort of exasperated short-covering.
4th bar to left of 5-19 marker did see some upside after it, but let's face it, price didn't stay above it for long.
DO you interpret that volume spike yesterday as potential turning point? (lower)
Do you have any interpretation/observation about times in the past when this has occurred?
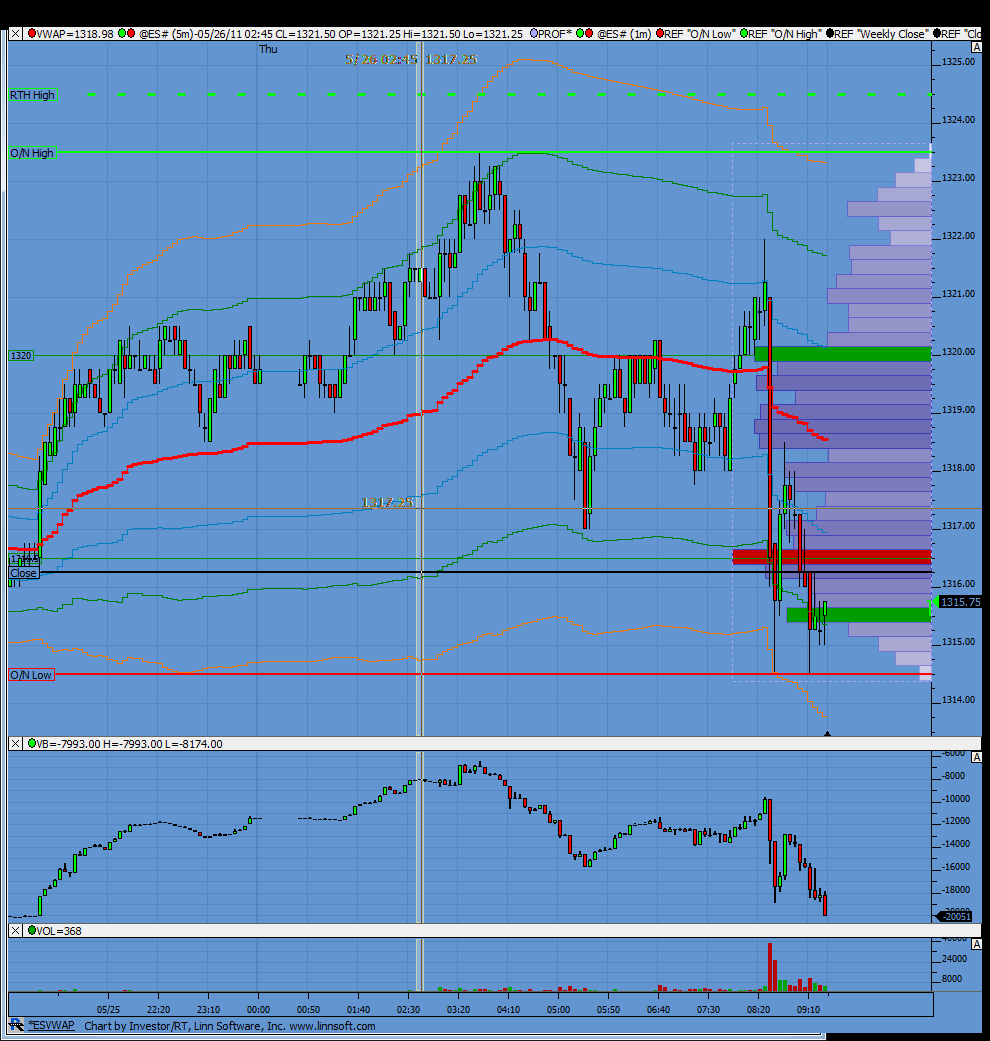
Long PP (14.50) with targets of daily GF (18.75), 52.8 PP-R1 (20.75), and O/N High, 78.6 PP-R1, and Monday RTH 0.382 projection up, all around 23.50.
Good luck everyone today!
Good luck everyone today!
Agree, Bruce...1310.50 is my downside key...
Got to one long target... flat now.
Market hit the 52.8% O/N retracement... I'd put that target around 1312.
Not counting that, I was watching that 12 area as key sup. Below that and we may see ~1304.50. IMHO.
Market hit the 52.8% O/N retracement... I'd put that target around 1312.
Not counting that, I was watching that 12 area as key sup. Below that and we may see ~1304.50. IMHO.
No Problem......
Methodlogies tend to be frameworks and understanding the lack of of tech at the time he probably used his thumb to guesstimate the 10 day moving average......oversimplfying I'm sure.
If you look at the chart.....does it look wrong? Or does it look very very right......it looks like that every day. This morning they were just backing up truck @1312-14 level.
His base method is very accurate....even some decades later....its works on everything I've pointed it at.....
Understanding the cycle is not crtical as each day is new.....but cycle position can increase probability of the event outcome.....if you review this week you'll see a cycle low with a
1. 2.618 long Night +11 then
2. 1.618 long Morn +18 then
3. 1 long then +15
4. tomorrow......we'll see right?....down cycle could begin again....but if you short a stretch failure you'll catch the big drop.
Emini Day Trading /
Daily Notes /
Forecast /
Economic Events /
Search /
Terms and Conditions /
Disclaimer /
Books /
Online Books /
Site Map /
Contact /
Privacy Policy /
Links /
About /
Day Trading Forum /
Investment Calculators /
Pivot Point Calculator /
Market Profile Generator /
Fibonacci Calculator /
Mailing List /
Advertise Here /
Articles /
Financial Terms /
Brokers /
Software /
Holidays /
Stock Split Calendar /
Mortgage Calculator /
Donate
Copyright © 2004-2023, MyPivots. All rights reserved.
Copyright © 2004-2023, MyPivots. All rights reserved.