Very interesting.
here's an old school chart read.
Thursday: price probed lower (Lower than Wednesday Lows) and discovered buyers, not sellers (if price had probed lower and triggered sell stops, price would have fallen further).
So, the presence of buyers has been established to exist ES SEP 55-52 area
there is a gap overhead at 75.75 to 84.50 SEP
If price can get above Thursday's H (1275.75, oh S%#*!!, it's already doing it, starting to print above 75.75 as I type), then the logical upside is half gap fill (1280.00) and then 84.50 (full fill)
the move above yesterday's H (75.75) is squeezing all the bears who never got out of their short positions yesterday.
As I write, ES has already exceeded 75.75 (beginning of gap), so (ideally for full) that area now has to act like support (support 75-72.50 area)
a stall near 77.50 would be natural (77.50-77.75 is 50% of last week's range).
BI
Big Mike
Rep: 8,097
Posts: 696
Originally posted by PAUL9
Very interesting.
here's an old school chart read.
Thursday: price probed lower (Lower than Wednesday Lows) and discovered buyers, not sellers (if price had probed lower and triggered sell stops, price would have fallen further).
So, the presence of buyers has been established to exist ES SEP 55-52 area
there is a gap overhead at 75.75 to 84.50 SEP
If price can get above Thursday's H (1275.75, oh S%#*!!, it's already doing it, starting to print above 75.75 as I type), then the logical upside is half gap fill (1280.00) and then 84.50 (full fill) I assume you are referring to ESM1? I have 74.50 as it's high?the move above yesterday's H (75.75) is squeezing all the bears who never got out of their short positions yesterday.
As I write, ES has already exceeded 75.75 (beginning of gap), so (ideally for full) that area now has to act like support (support 75-72.50 area)
a stall near 77.50 would be natural (77.50-77.75 is 50% of last week's range).
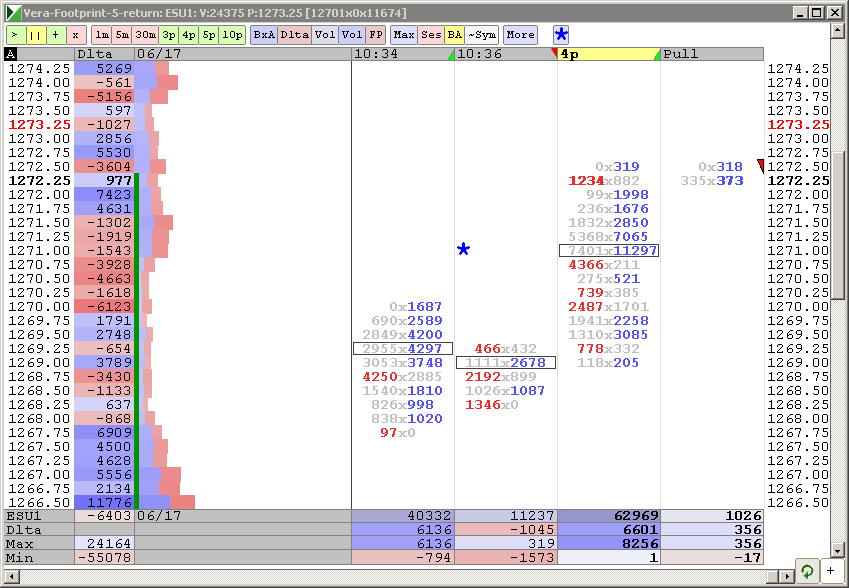
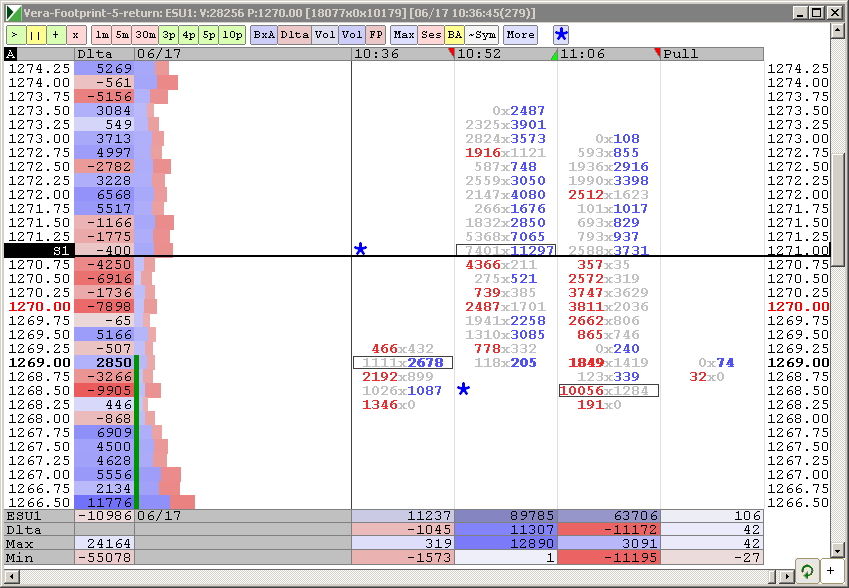
Orders at 1283.75 Sell NPOC and Paul's reference.
Buying at 1268.50 around yeasterday's high and VAH.
ESU1
Good luck to all!
PA
PAUL9
Rep: 14,898
Posts: 1,170
Forest and trees.
We look at minutia. I constantly have to keep reminding myself to see the 'forest'
I'm want to post a chart, can soemone help me out here...
do I 'attach' it
or do I upload it
in order to just get a chart to be visible in the thread
We look at minutia. I constantly have to keep reminding myself to see the 'forest'
I'm want to post a chart, can soemone help me out here...
do I 'attach' it
or do I upload it
in order to just get a chart to be visible in the thread
TR
TradeQueen
Rep: 879
Posts: 204
If I remember correctly... BOTH..
the file needs to be uploaded first and then it will show up on a list in the attached area.
Have your cursor where the image will be and select the uploaded file from the attached list. I think that should do it.
the file needs to be uploaded first and then it will show up on a list in the attached area.
Have your cursor where the image will be and select the uploaded file from the attached list. I think that should do it.
Originally posted by PAUL9
Forest and trees.
We look at minutia. I constantly have to keep reminding myself to see the 'forest'
I'm want to post a chart, can soemone help me out here...
do I 'attach' it
or do I upload it
in order to just get a chart to be visible in the thread
DA
day trading
Rep: 39,586
Posts: 6,369
Originally posted by PAUL9
Forest and trees.
We look at minutia. I constantly have to keep reminding myself to see the 'forest'
I'm want to post a chart, can soemone help me out here...
do I 'attach' it
or do I upload it
in order to just get a chart to be visible in the thread
http://www.mypivots.com/board/topic/10/1/how-to-upload-charts-and-images-to-the-forum
CH
chrisp
Rep: 568
Posts: 111
fwiw... June contract closed at 1281, wonder if we will test that level at all, I have 80.5 as a 30 min range expansion target to the upside if can BO
PA
PAUL9
Rep: 14,898
Posts: 1,170
thanks for explanations (TY MM)
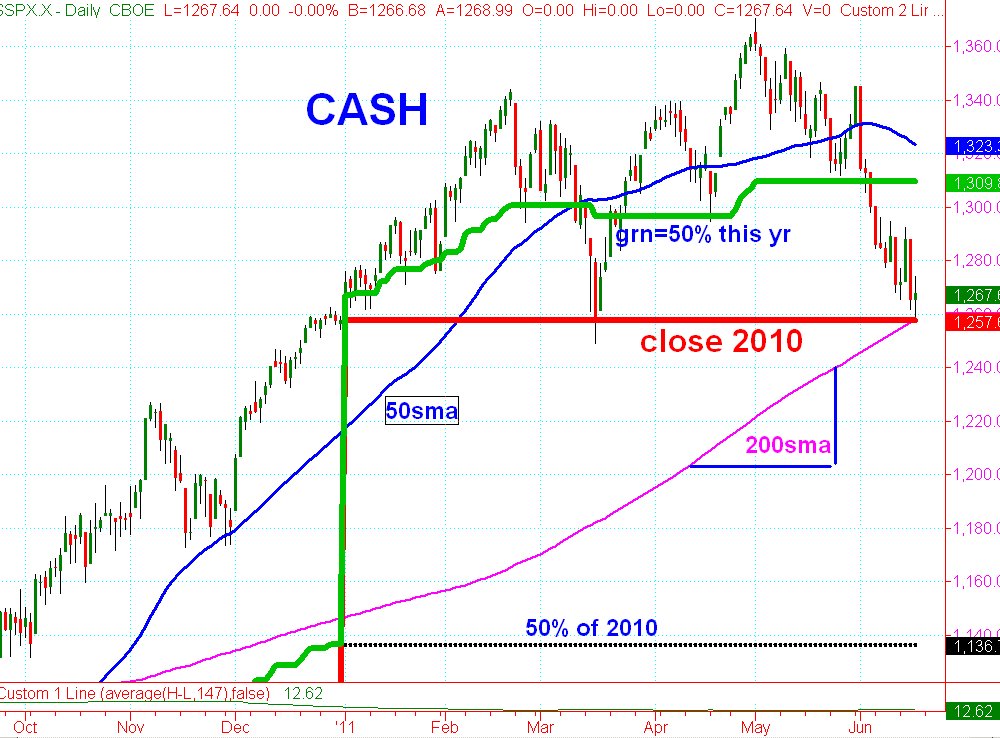
we are always looking at the trees. here's a picture of the forest
make your own assumptions about what might be important in the "forest."
(Prior year H (2010) not shown because it is virtually identical to Close of the year 2010 (close of the prior year is the thick Red line marked close 2010)
money managers peg yearly returns to the close of the prior year.
Chart is CASH S&P500
Click image for original size