JI
jimkane
Rep: 3,058
Posts: 33,089
The week starts out 'interesting'. Gold is only a few cents from the 'magical' $1600 level. I think the only magical level is $10,000, and the musings on when that gets taken out. If it does, and the moves were proportional, that prices gas at the pump around $30/gal and crude around $400. Imagine food prices then. The Swissie is exploding, and the EUR/CHF just set another new record low, as parity is now the talk. And this has our futures down a whopping 1.75 points. Wow, pretty scary, the ES down 1.75 points.
AL
albert
Rep: 99
Posts: 3,094
Thanks, rat. I, too, enjoy your charts and I am trying to learn to look at "the bigger picture" by studying your charts. I sure need to learn more about median lines and how to draw them.
Good Trading,
Al Kamego
Good Trading,
Al Kamego
TX
tx_ches
Rep: -10
Posts: 514
Al, I agree with much that you said. I think I read the market better when I look at what the bears want and what the bulls want. I think it also helps my brain perceive the real action and not be deceived by adding context based on emotion.
From my studies, I know that the brain is always adding context based on emotion whenever it faces uncertainty. Because nothing is certain in the market, traders are always facing uncertainty. If you are long and the market is going against you, then the brain will take the emotion of fear of loss and add context. If you are long and the market is going your way, then the brain will take the emotion of greed and add context based on it.
Therefore, I feel I must proactively be looking both as a bear and as a bull so that I can open up my brain to see what is really in the price action. Doesn't always work but that's the intent. In summary, I agree with you that trying to be non-biased helps in reading the action. When I have 40,000 hours of screen time like Jim then that may not be needed.
I like your posts.
Jim has told me I need to work on context in my posts but I'm not experienced enough to do that. It is not that I don't draw the lines on HTF charts. But I have so many. Which to lean on as the driver becomes the question.
I learn from most of the posts here. It is a great place.
Originally posted by albert
Great posts, Jim and roofer. As I struggle with "context," I also struggle with "premise." I definitely need to improve in these areas. I "feel" I get slammed the hardest when I have an up or down bias. I therefore try to not trade with a bias, because it does not seem to work for me.
Al Kamego
AL
albert
Rep: 99
Posts: 3,094
ches,
Thanks. I also enjoy your charts and comments. I also agree that this forum is terrific.
Good Trading,
Al Kamego
Thanks. I also enjoy your charts and comments. I also agree that this forum is terrific.
Good Trading,
Al Kamego
JI
jimkane
Rep: 3,058
Posts: 33,089
I did it, I won a gazillion dollars! Time to retire.
Originally posted by jimkane
BTW, I bet a gazillion dollars that MSFT will be up tomorrow.
RA
rat89
Rep: 0
Posts: 7,015
make that a 1.46 dbs
I have no idea what the probability is for this one....
I have no idea what the probability is for this one....
Click image for original size
RA
rat89
Rep: 0
Posts: 7,015
Click image for original size
Click image for original size
Click image for original size
JI
jimkane
Rep: 3,058
Posts: 33,089
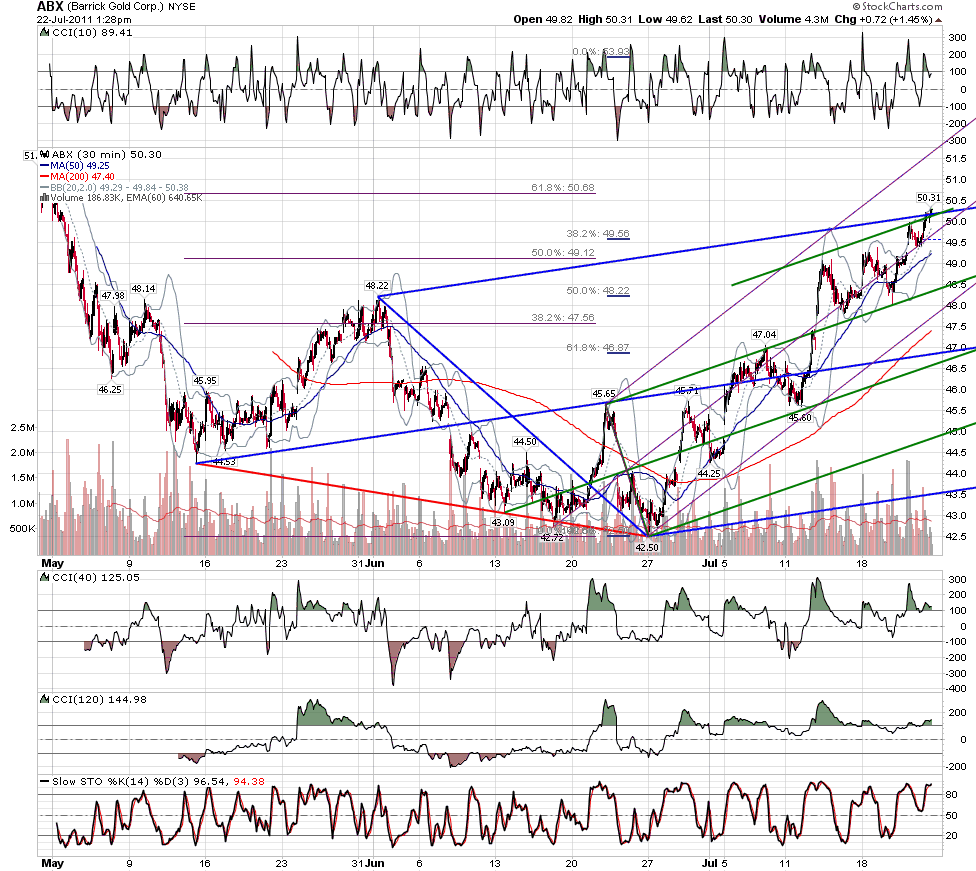
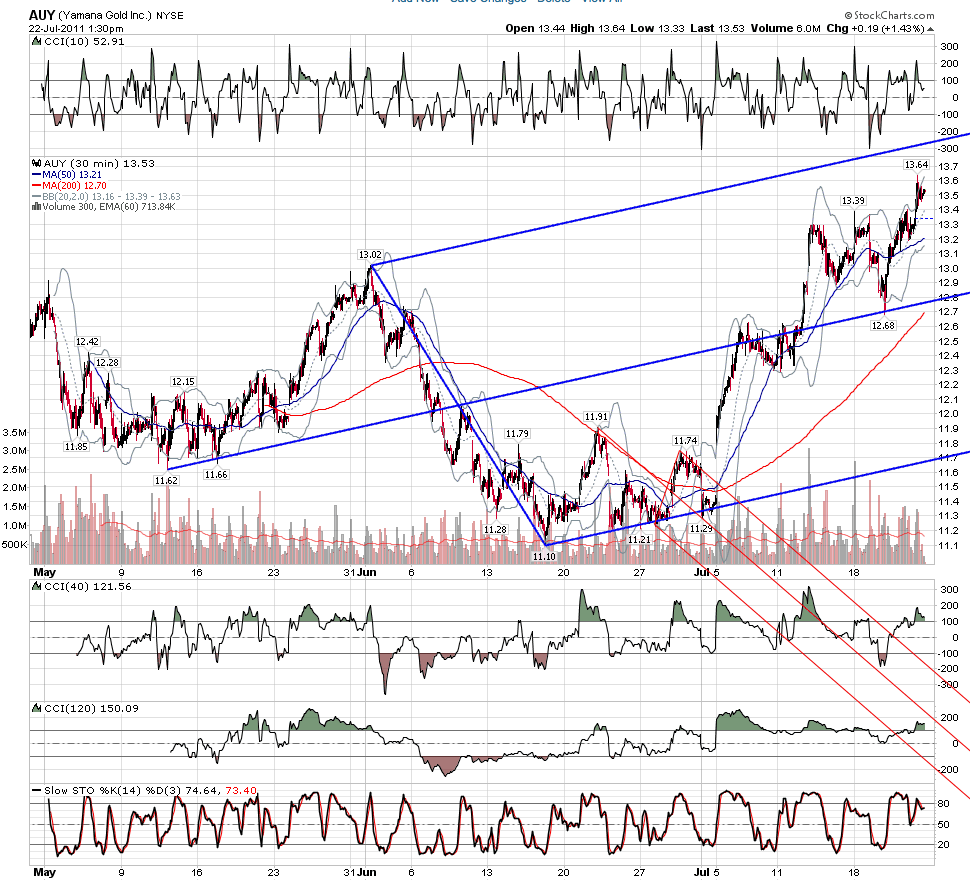
This 42.75 high is a critical rollover spot, but I just can't see it. I'm trying, and I'm ready, in case, but the MRRD's are just so dominant in the market right now, I can't see them letting it go. Not after they took it down earlier. But, we'll see. Maybe...
RO
roofer
Rep: 3,689
Posts: 3,574
rat- yes, as of late, lines are wandering in stockcharts.has happened before...
JI
jimkane
Rep: 3,058
Posts: 33,089
I guess what I am saying is that not every time price hits a line, or lines confluence and price hits them, it's an area that produces a potential trading edge. With experience one can make an attempt at filtering out these areas that just don't have the right look to them. I'm not really talking about subtle, almost invisible variations here, I'm talking about 'obviously has potential', and 'obviously looks totally wrong'. This is frequently something that can be seen by eye real easily, but is very, very hard to program into a computer. I wish I had a chart example off hand for you, but I don't.
Originally posted by tx_ches
Jim, what do you mean when you say "our eyes would say the geometry is not good." How can geometry be bad?
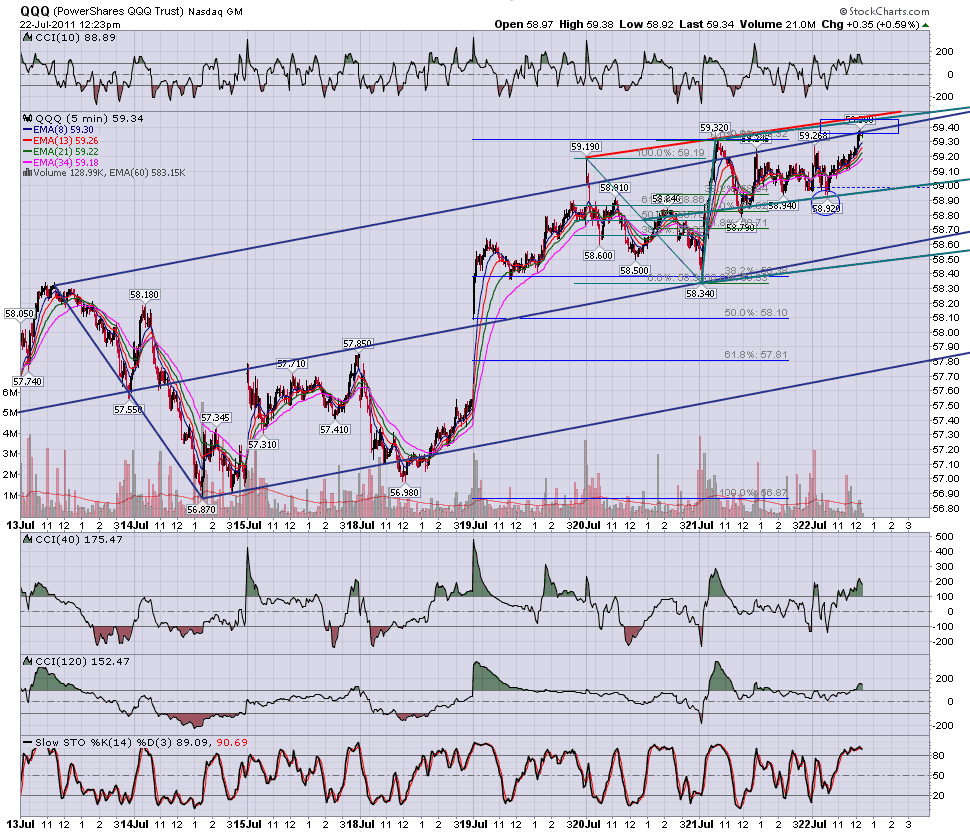
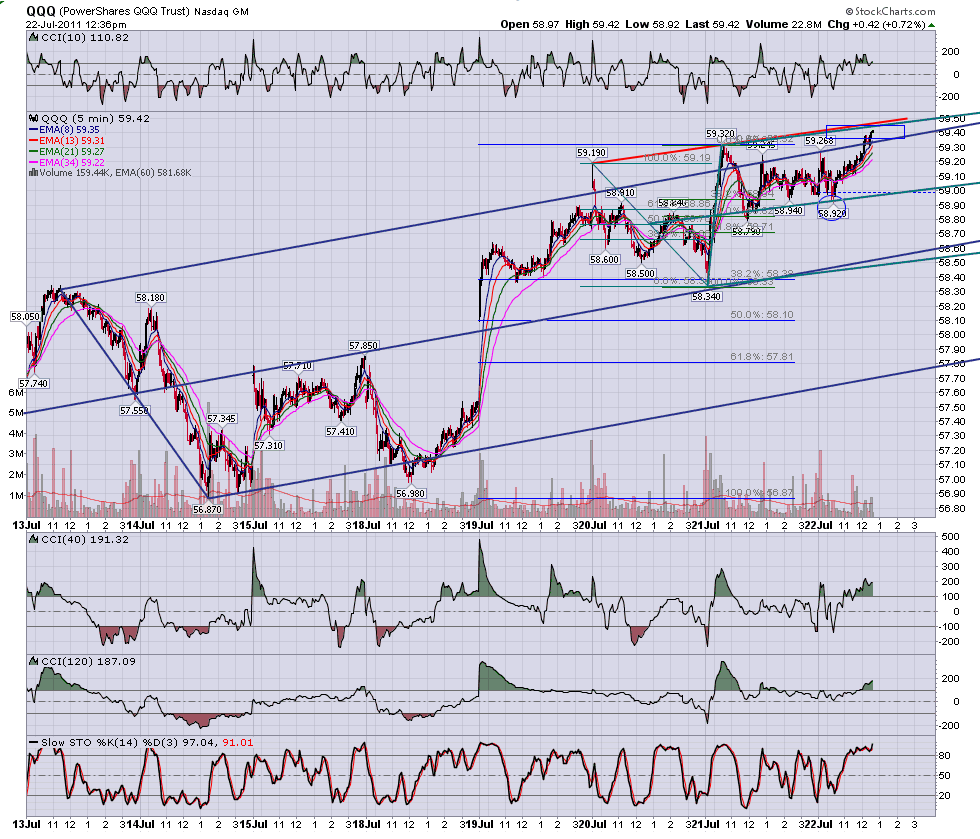
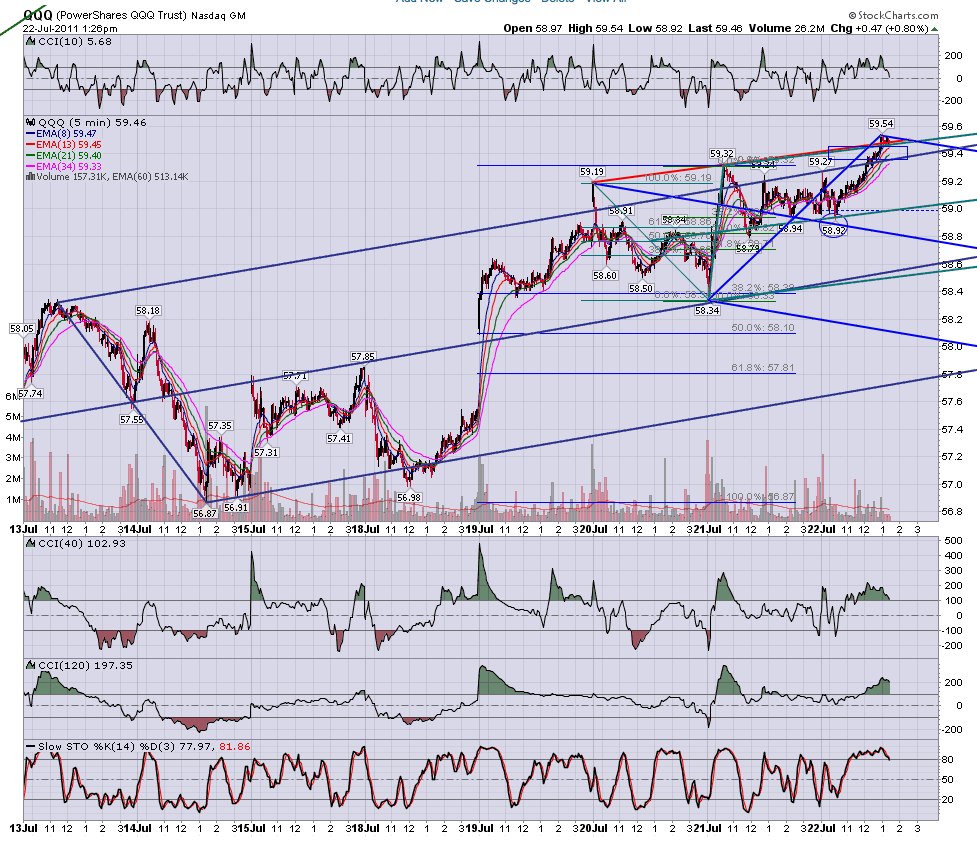
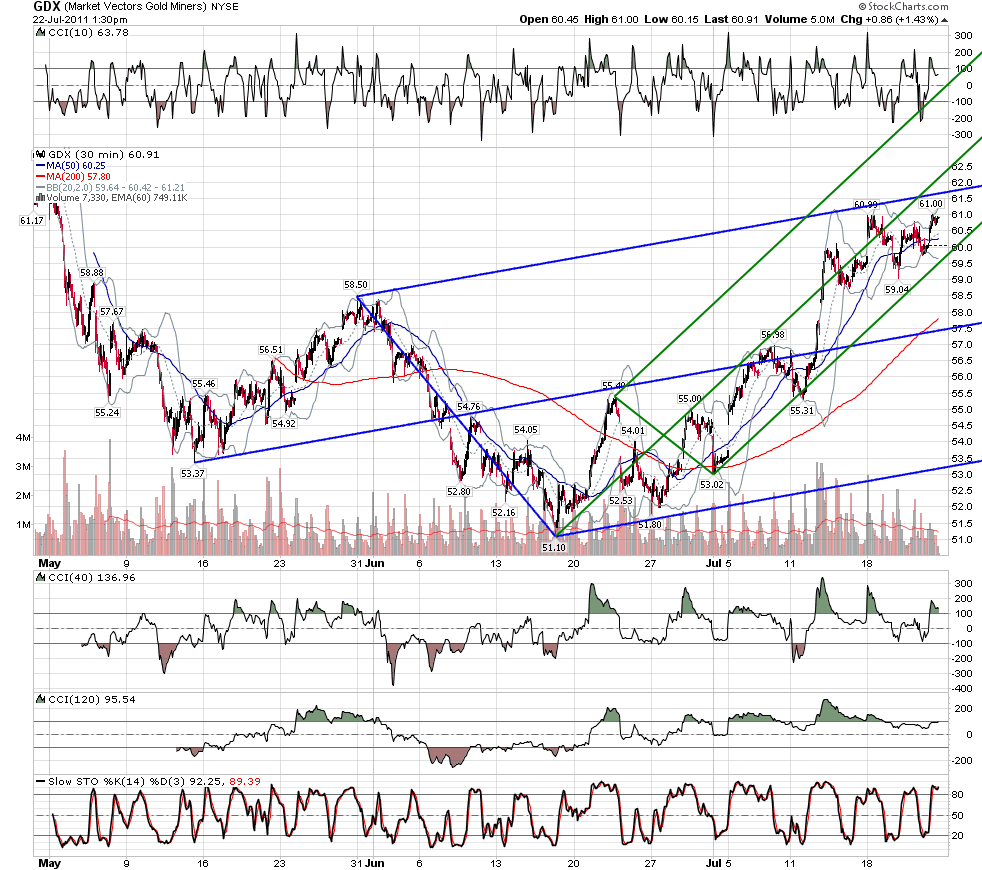
I'm not convinced the algo's are using the same median lines as roofer all the time. On the QQQ's, I drew 2 other sets before I saw roofer's set and even after I drew another set. So all together there were 4 sets with lines going into his areas. The algos could easily have programmed in 2 of them without using the more minor swing low that roofer used.
How heavily do you think the algos rely on measured moves? It seems like I see a lot of median line sets that capture a measured move. I wonder if that is what the algos key on when it is looking like they key on a median line set?