JI
jimkane
Rep: 3,058
Posts: 33,089
The week starts out 'interesting'. Gold is only a few cents from the 'magical' $1600 level. I think the only magical level is $10,000, and the musings on when that gets taken out. If it does, and the moves were proportional, that prices gas at the pump around $30/gal and crude around $400. Imagine food prices then. The Swissie is exploding, and the EUR/CHF just set another new record low, as parity is now the talk. And this has our futures down a whopping 1.75 points. Wow, pretty scary, the ES down 1.75 points.
JI
jimkane
Rep: 3,058
Posts: 33,089
Okay, they are coming in nicely now for the ES after that little dip. Things are as they should be (in this, the best of all possible worlds, for you literary fans out there).
JI
jimkane
Rep: 3,058
Posts: 33,089
Still coming in for it. One tick from the high for the move. Like I said...
TX
tx_ches
Rep: -10
Posts: 514
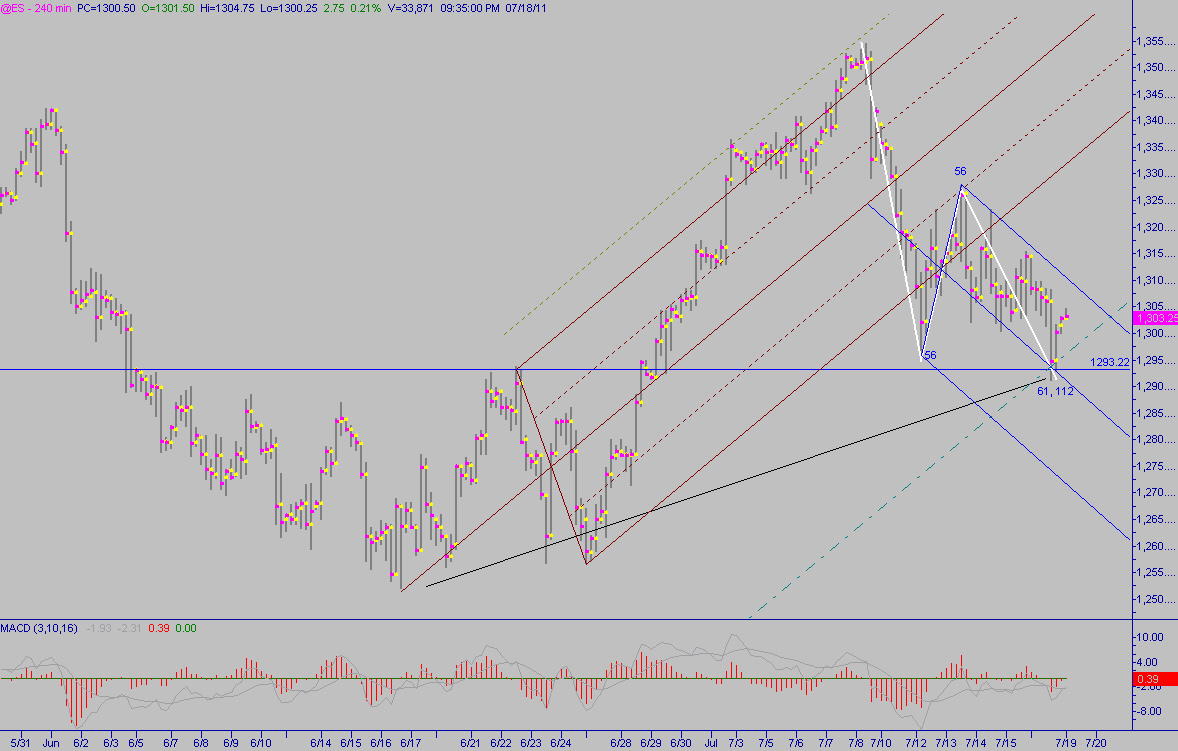
Jim, I could not find any abcd on any timeframe down to the 5 minute AFTER the 1.128 was hit. Did you see an abcd somewhere?
I did find an abcd (marked in white) on the 240 minute that led to the 1.128. Do you see that as the abcd a Kane trader would take to get involved?
The blue median set is an adjusted set. The teal line is -75 WL of the brown set. I found fib confluence of the 112 and the 61 retrace of the up leg.
I did find an abcd (marked in white) on the 240 minute that led to the 1.128. Do you see that as the abcd a Kane trader would take to get involved?
The blue median set is an adjusted set. The teal line is -75 WL of the brown set. I found fib confluence of the 112 and the 61 retrace of the up leg.
Originally posted by jimkane
But the bigger picture, which I fully suspected last night, would be a breakdown off all that sideways 'consolidation', I figured to the 1.272 (it went to the 1.128 to the tick), and then big up, as that would finish it off.
Click image for original size
JI
jimkane
Rep: 3,058
Posts: 33,089
tx, although what you highlight in white is a form of an ABCD, I wasn't taking that into account to any great extent. What I was doing was using additional intraday/daytrading concepts to assist me here.
For example, I look at where I expect the daily range may be (the possible high and low for the day), a big dose of 'context', which tells me what I think 'they' are planning to do with the market, and, like joed, I feel the market makes two or three 'moves' in an average day, and so on. So, if the LOD was a big area, even if not an ABCD, I may feel it will transition from a down move to an up move off that area.
I was also looking at that theory of mine on how it chops in the range after a big move, with a bias opposite the move. That pointed me sideways or up, depending on other factors (which I felt pointed it up). I also notice the game they play a lot lately is to sell it down, and then about an hour and a half into the session it bottoms (today it was two and a half hours in) and then it rises constantly, usually in an incessant grind.
So it was today. It had two moves, down into the time area it usually bottoms at, and then up. These, and many other factors coming from so much experience, and I had a bias off that low. Then I just look for a way in. It gave a great little ABCD that completed at 13:17 (there were unstructured corrections to get in well before that). Hope this helps.
Originally posted by tx_ches
Jim, I could not find any abcd on any timeframe down to the 5 minute AFTER the 1.128 was hit. Did you see an abcd somewhere?
I did find an abcd (marked in white) on the 240 minute that led to the 1.128. Do you see that as the abcd a Kane trader would take to get involved?
The blue median set is an adjusted set. The teal line is -75 WL of the brown set. I found fib confluence of the 112 and the 61 retrace of the up leg.
Originally posted by jimkane
But the bigger picture, which I fully suspected last night, would be a breakdown off all that sideways 'consolidation', I figured to the 1.272 (it went to the 1.128 to the tick), and then big up, as that would finish it off.
Click image for original size
JI
jimkane
Rep: 3,058
Posts: 33,089
And still going. There's the new high for the entire move. Now 16.50 points off the low. Recall I said I see 20+ points coming? It's now at a super-key area of critical lines here. If it breaches this and can get going, I'd think it would really get going. If it were going to run out of gas, this area right here should do it. Somehow I just can't see it falling in here, but nonetheless, this is a very important area for it to prove itself. Also remember the pattern they like coming off bottoms, where they gun it up, drop it down a bit in the dead of night, then start the real gun up. Again, though, I think this is planning to jump up through this area here, so if there is to be a pullback before the next leg, I think it would have to be later.
Update before I even got to post this. It just exploded through at least three key lines. Fake through trap and dump? I don't see it, but it is possible. BTW, gold is smokin' off to another new all-time high. Okay, back to bed for me...
Update before I even got to post this. It just exploded through at least three key lines. Fake through trap and dump? I don't see it, but it is possible. BTW, gold is smokin' off to another new all-time high. Okay, back to bed for me...
Originally posted by jimkane
Energizer bunny. Still going...
JI
jimkane
Rep: 3,058
Posts: 33,089
One last thought. If this can keep going, my next really key level that I am watching is around 1320, and I have a time factor near the close on Tuesday.
RA
rat89
Rep: 0
Posts: 7,015
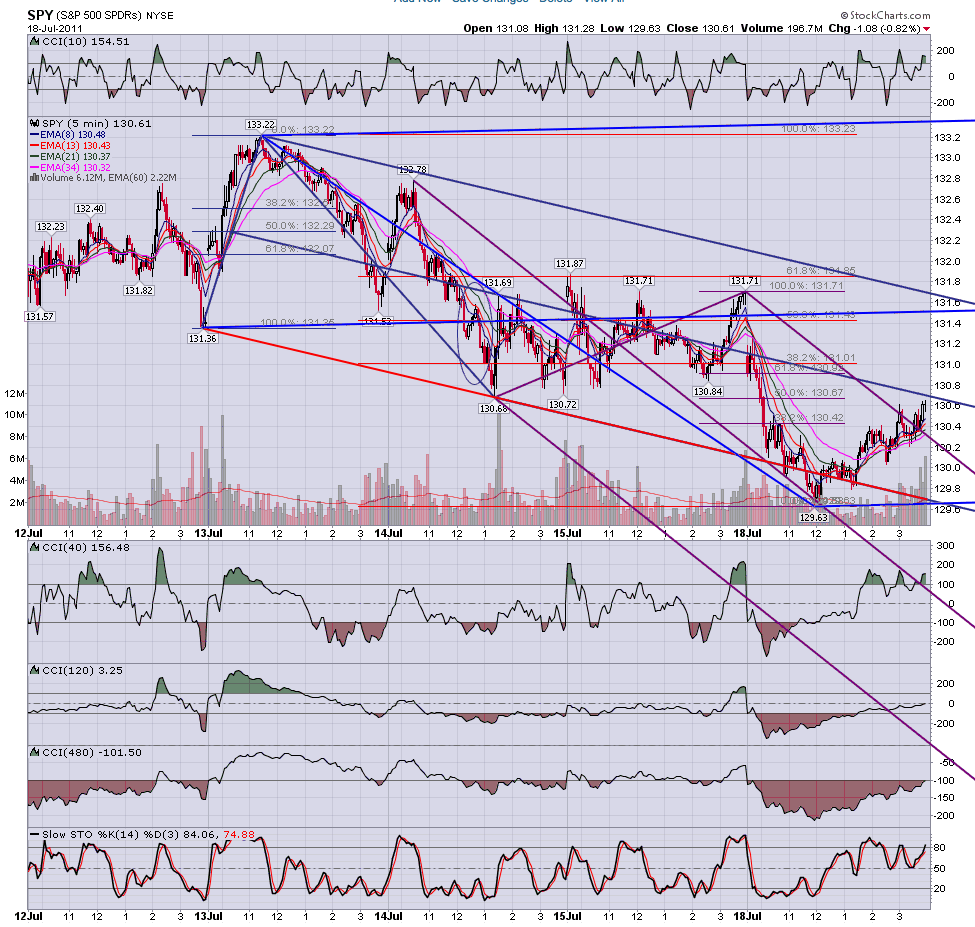
great read jim, and barring bad news from housing numbers, it is set to gap open at or near the median line of this set I just wasn't sure about due to the overrun at the low.....131.43 = .50 off 133.22.....131.47 = .382 off 134.44 and .886 off 131.71
Click image for original size
TX
tx_ches
Rep: -10
Posts: 514
Thank you, Jim. That helps. I thought I'd missed something and I find I am missing experience.
Originally posted by jimkane
What I was doing was using additional intraday/daytrading concepts to assist me here.
JI
jimkane
Rep: 3,058
Posts: 33,089
I guess what I am saying is that not every time price hits a line, or lines confluence and price hits them, it's an area that produces a potential trading edge. With experience one can make an attempt at filtering out these areas that just don't have the right look to them. I'm not really talking about subtle, almost invisible variations here, I'm talking about 'obviously has potential', and 'obviously looks totally wrong'. This is frequently something that can be seen by eye real easily, but is very, very hard to program into a computer. I wish I had a chart example off hand for you, but I don't.
Originally posted by tx_ches
Jim, what do you mean when you say "our eyes would say the geometry is not good." How can geometry be bad?
I'm not convinced the algo's are using the same median lines as roofer all the time. On the QQQ's, I drew 2 other sets before I saw roofer's set and even after I drew another set. So all together there were 4 sets with lines going into his areas. The algos could easily have programmed in 2 of them without using the more minor swing low that roofer used.
How heavily do you think the algos rely on measured moves? It seems like I see a lot of median line sets that capture a measured move. I wonder if that is what the algos key on when it is looking like they key on a median line set?