The debt limit issue should be resolved soon.
Be ready.
RA
rat89
Rep: 0
Posts: 7,015
it just that you are smart enough to know what they know!
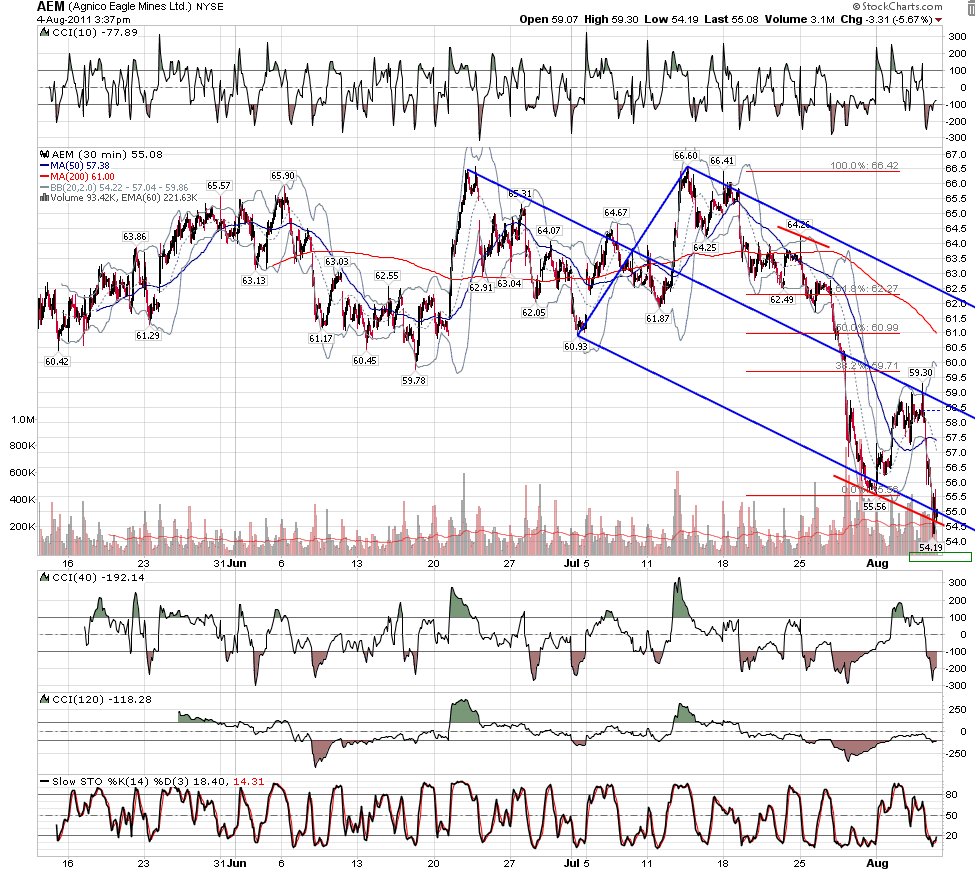
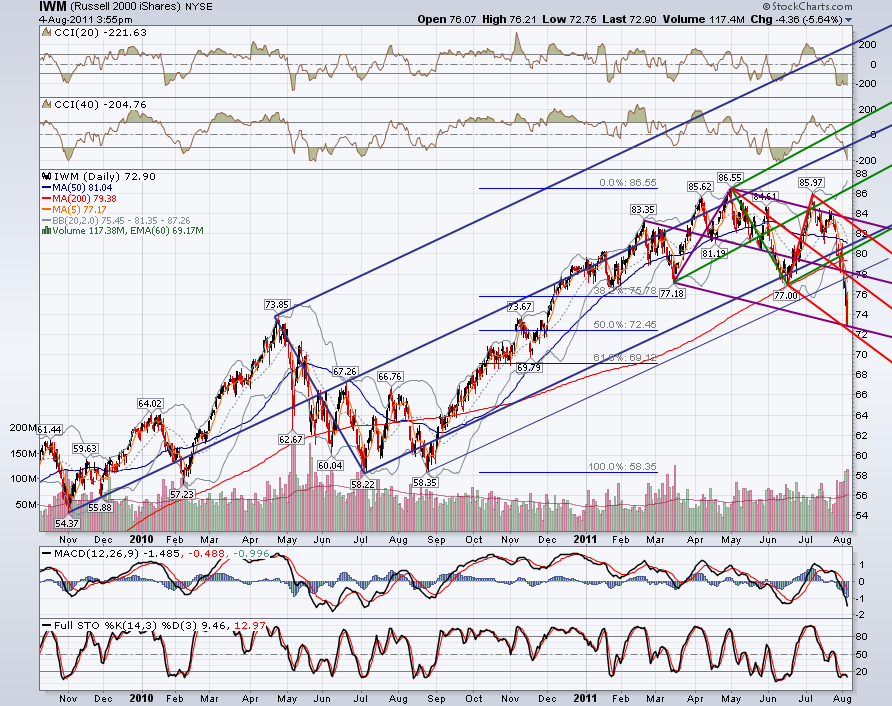
here was mine....not as advanced, but there it is
Originally posted by roofer
try telling me the computers don't know everything i know.....
here was mine....not as advanced, but there it is
Click image for original size
RA
rat89
Rep: 0
Posts: 7,015
I have nothing but respect for how you have amassed such a wealth of knowledge....considering that these turns are so regular, it's amazing that you don't see more traders taking advantage of it and knowing it...someone is making out very well. If I develop 1/10th the edge I will be very happy, but I can tell you it doesn't come quickly. Even knowing the little I know it is so easy to be too early, too late, looking the wrong way at the most important times...
Originally posted by roofer
you are welcome rat...if you dig deep on your 5 and 15, you will find dozens of turns based on tools... based on everything i expressed... that is why i just could not believe that SLV was not about to break big...but now.... we must seriously wonder if that big break was just a prelude to SLV moving higher....
TX
tx_ches
Rep: -10
Posts: 514
Roofer makes it look easy, but as Rat said, it is not.
Though roofer can sum up what he does in only a few sentences as opposed to what Jim does, I think roofer's is actually more complicated.
I'm willing to learn from both!
I put my SLV "findings" in a separate topic. I welcome your comments. I know I missed tons of stuff. And roofer probably wanted more but because he didn't specify, I only concentrated on the 2 trades - the SLV long on 8/1 and the SLV short setups from yesterday and today.
I had not looked at any of today's posts after roofer's first post about a teaching set today. Catching up now after doing the "homework".
JI
jimkane
Rep: 3,058
Posts: 33,089
I thought Carl Futia's update post from yesterday was quite interesting. I particularly liked his last line:
BUY - BUY - BUY !!
What made it interesting, to me, was all the indications he had and how he interpreted them. The post is well worth reading. It's short, and will take about one minute, tops.
Now, I can't say much here, because I did think they'd likely run it up off that low for a bit. But I was thinking short-term, not 1400 like Carl is thinking, and I changed my mind as soon as it respected that area I mentioned.
I think my point here is don't be married to one side (Carl seems to me to be bullish no matter what), and be cautious with contrary approaches, because they can work great when things are 'normal', but like oversold can get more oversold, contrary can totally 'not work' when things get crazy. And we are on the precipice, again, of crazy like the world has never seen, in my opinion.
http://carlfutia.blogspot.com/2011/08/update.html
JI
jimkane
Rep: 3,058
Posts: 33,089
I was going to post this a little bit ago, but was tinkering with the above post. I just got a short-term ES buy signal. A conservative trigger on this happened around 97.50. There were a few more aggressive triggers a bit lower. I'm not thinking this has any real juice to go up, but if they decide to start a bounce this may have been my chance to position, so I had to consider that. In situations like this, though, I many times see an initial grind up, a sharp flush down to shake 'em out, then the real move. Now we see.
JI
jimkane
Rep: 3,058
Posts: 33,089
And there's a new low for the move. I didn't think it would have the juice, and so far it hasn't had it. But, is that the shakeout I mentioned? I'm not getting the best confluences anywhere coming up on the downside on the higher timeframe, and I'm wondering what that is telling me? I have some key Fib related stuff right here, but the two critical, key lines are below in the general areas of 1170 and 1120.
It's hard to pinpoint the spots because the Fib and other stuff are arrayed over a wide area. The .382 off the 2009 low is at 1103. The .300 is at 1161, and I have another super-key line around 1155, so, given this goes back over years, the area is about 1155-70. That's not that wide for that big of a timeframe. But, alas, there are things I like to see in a confluence area, and many are not there.
I'm really thinking this could try for a lower area (not necessarily straight down) around the .447 which is at 1057. If I get the time and energy I'll post my 'doomsday' deflation scenario on the weekly $SPX chart. I don't see it happening, but it is cool enough to at least look at. So, for now, and I'm tentative on these levels and may refine or change them later, here they are:
Watch right here at 1188-89
1155-70
1120-30
1057
I am also open to an implosion scenario if the repo or money market freezes up, which could happen any second. This thing is flirting with doomsday issues that the Fed couldn't even begin to touch with all the money it could digitally print. If any of them happen, we could see downside previously unimaginable. Seriously.
RO
roofer
Rep: 3,689
Posts: 3,574
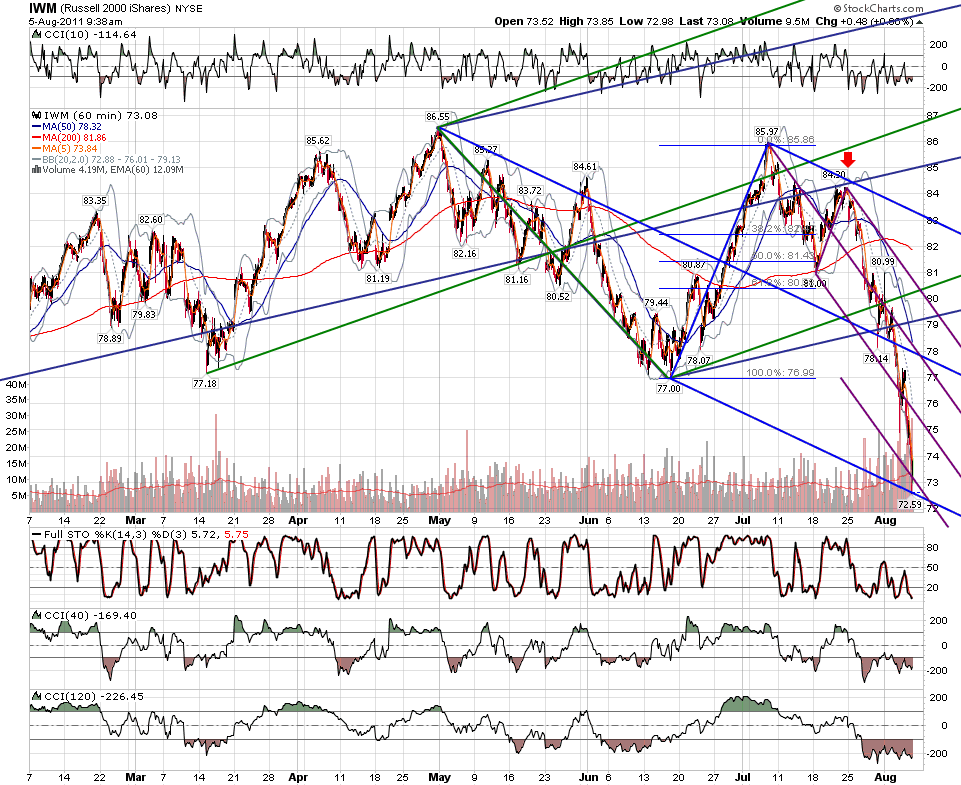
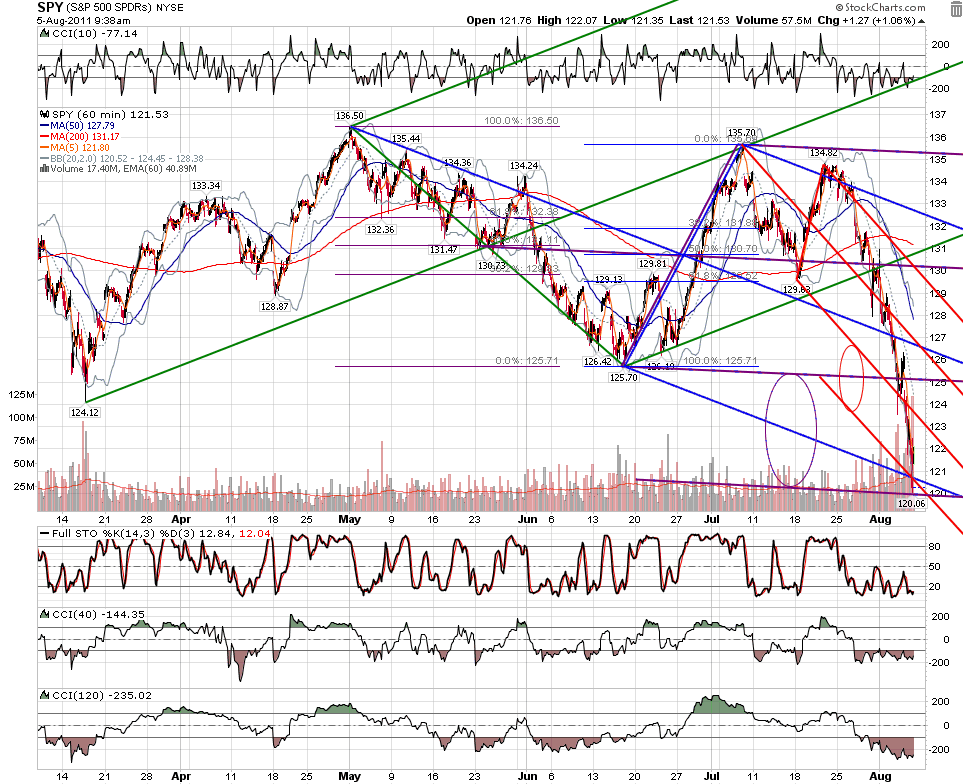
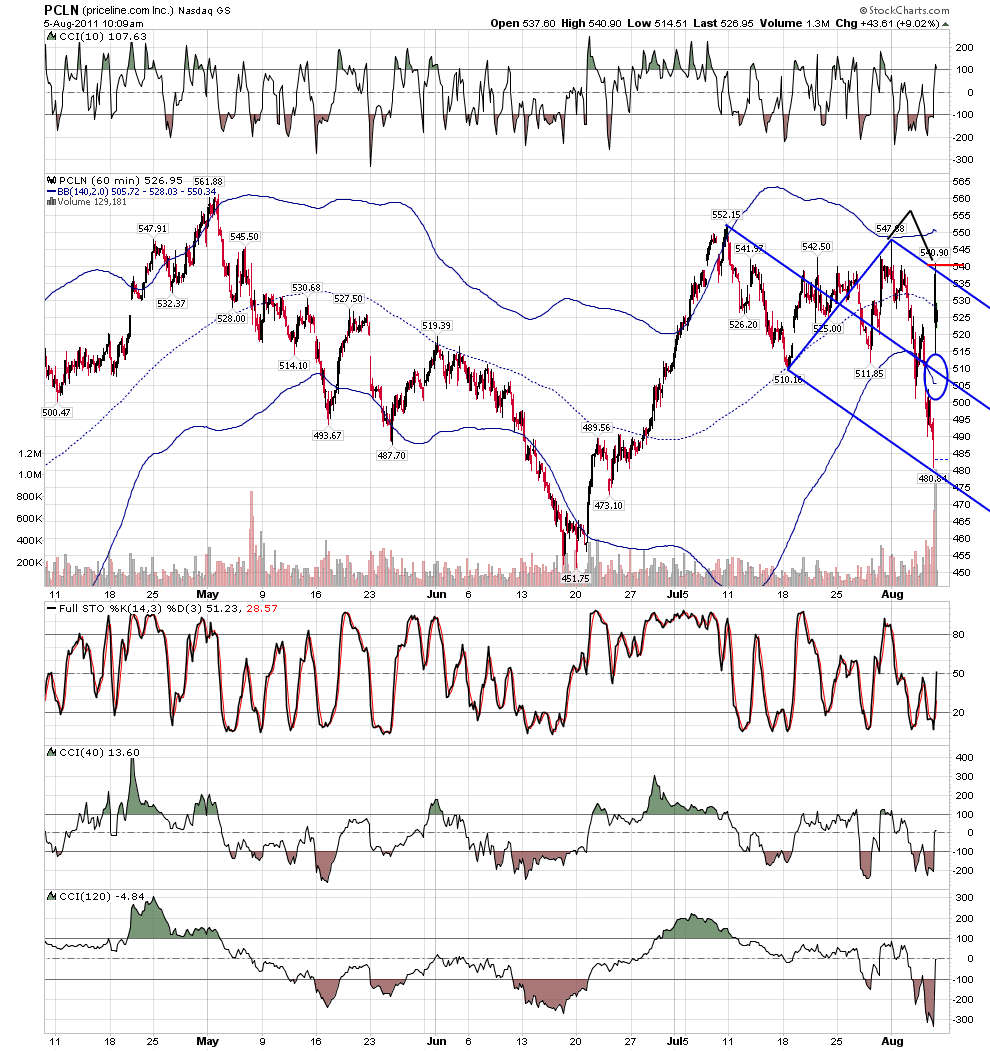
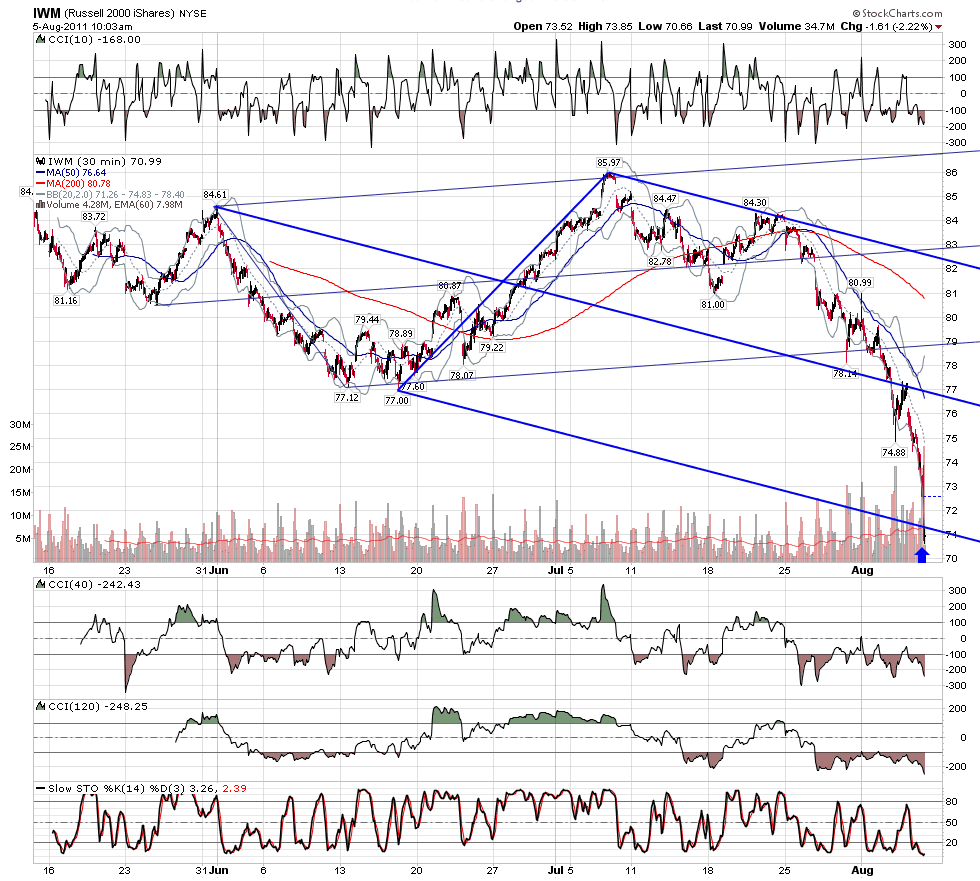
naw.... do we know what the computers are doing?
Click image for original size
AL
albert
Rep: 99
Posts: 3,094
Originally posted by tx_ches
Great job, Al. You caught a lot more things. You are good at drawing the SL. I particularly missed 2 even after drawing 1 and 3. You also caught many more .886. I particularly like your 6.
I thought this was a great exercise on how well the tools can work near a turn as joed has said. For myself, it also showed me that I had made some progress with the tools since the last time roofer gave a list of charts to try them on.
For the record, I did try Jim's two recent detailed postings on action, levels, and turns but gave up in frustration. I never know with his stuff if he means 240 min or 3 min.
Thanks, tx. I spend probably too much time looking at the smaller details and not enough scoping out the "bigger picture," like the turquoise line 4. Kane TD ABCD. That is a good one. I looked at your work and picked it up right away. I do not know if I would have seen it by myself. I need to spend more time looking at larger as well as smaller timeframes for larger Kane ABCDs and structure. Many times I have been mentally involved in a smaller scale pattern, and missed an easy, larger Kane ABCD. This work requires a lot of expertise. Please keep up the good work.
Thanks, roofer, for the invitation for us to try our hand at your techniques on the SLV chart. I am sure there are a large number of things that I missed.
Thanks, Jim, for hosting this forum and sharing your thoughts. There is surely a lot of your work that I don't "get," but I am working on it.
Good Trading,
Al Kamego