The debt limit issue should be resolved soon.
Be ready.
RO
roofer
Rep: 3,689
Posts: 3,574
long time since i have been down on 1 min charts scalping for moves that last 5 minutes...
AL
albert
Rep: 99
Posts: 3,094
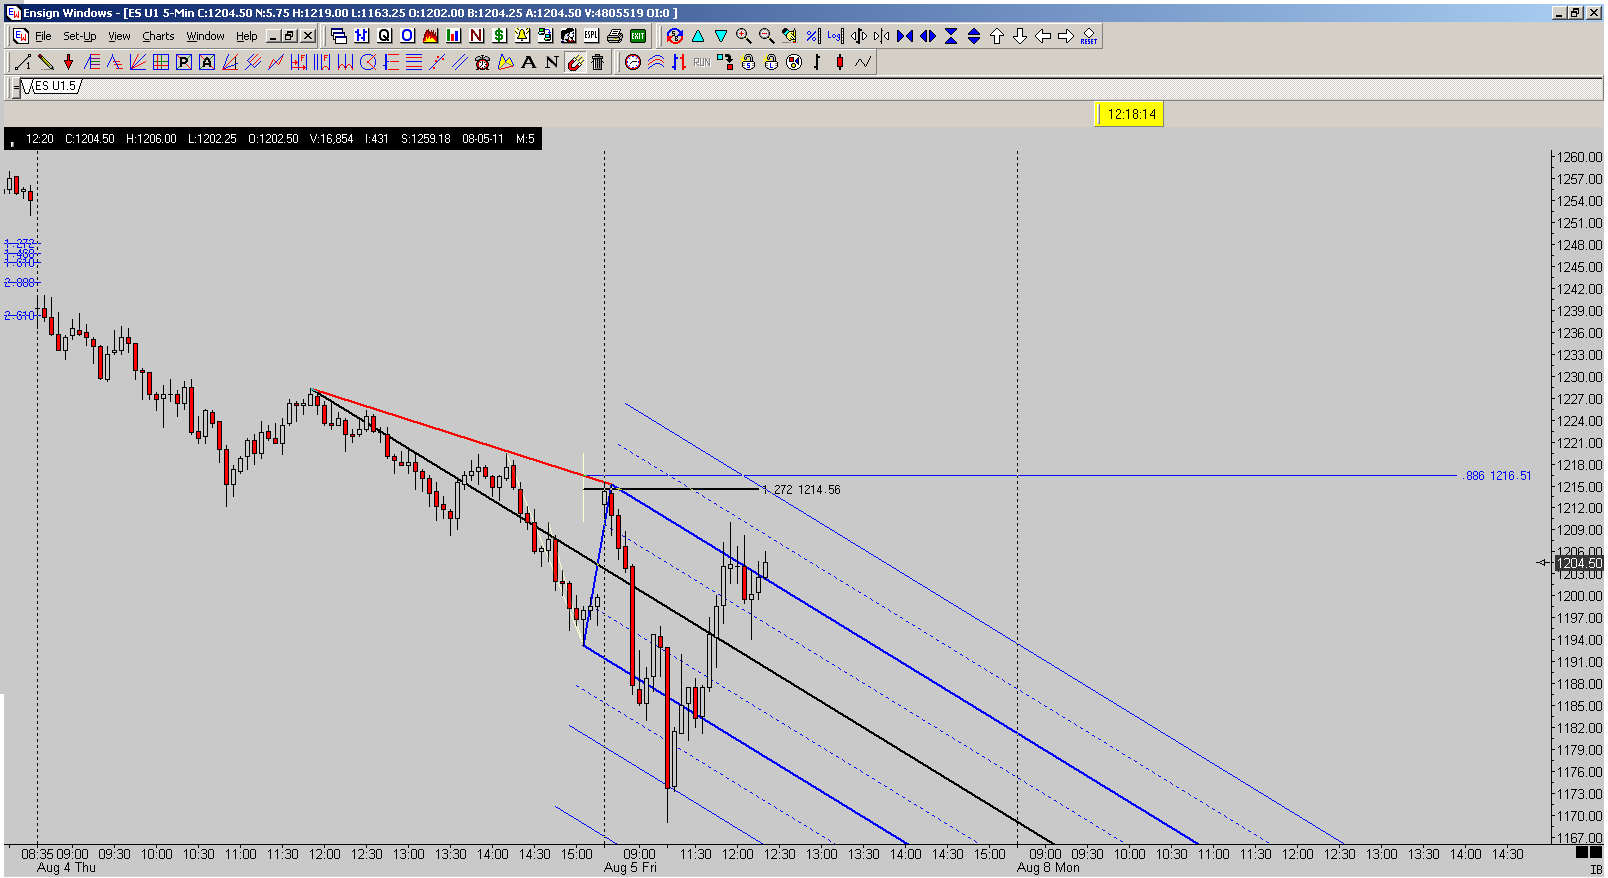
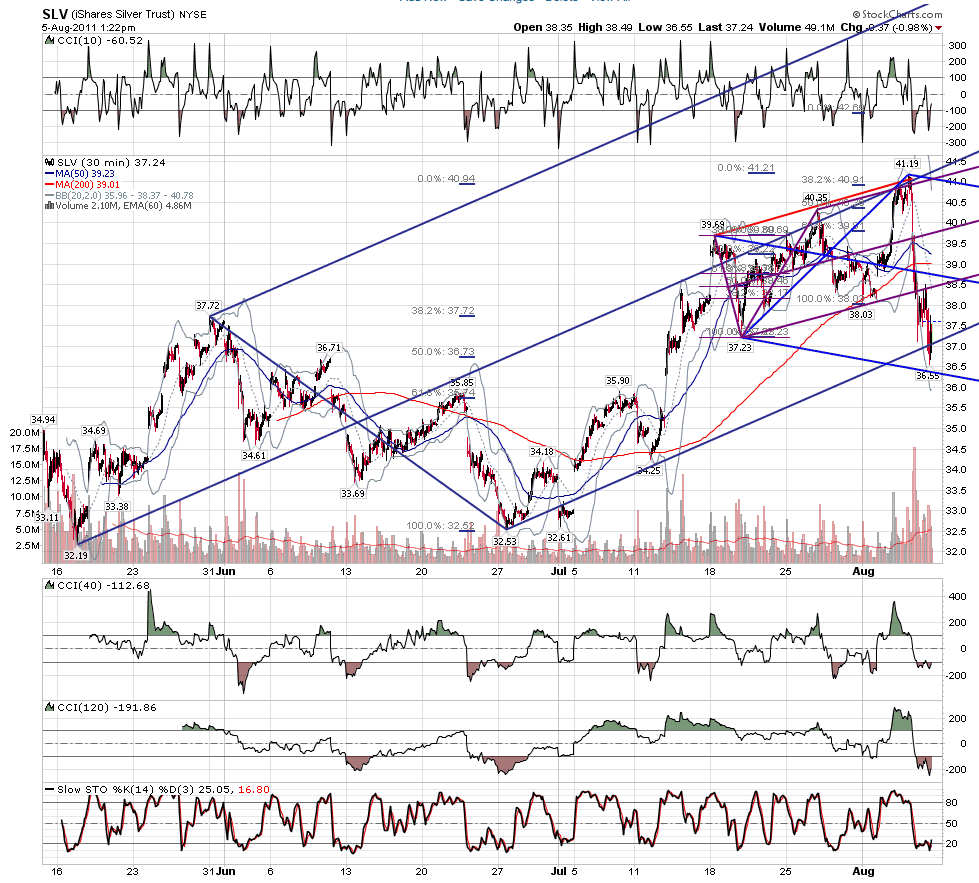
At open: Gap on 5, 0.886, 1.272 fibos, & SL. I was ready for it this time!
5 Point Pattern. Kane 4 PCP in Leg.
Al Kamego
5 Point Pattern. Kane 4 PCP in Leg.
Al Kamego
Click image for original size
Click image for original size
JI
jimkane
Rep: 3,058
Posts: 33,089
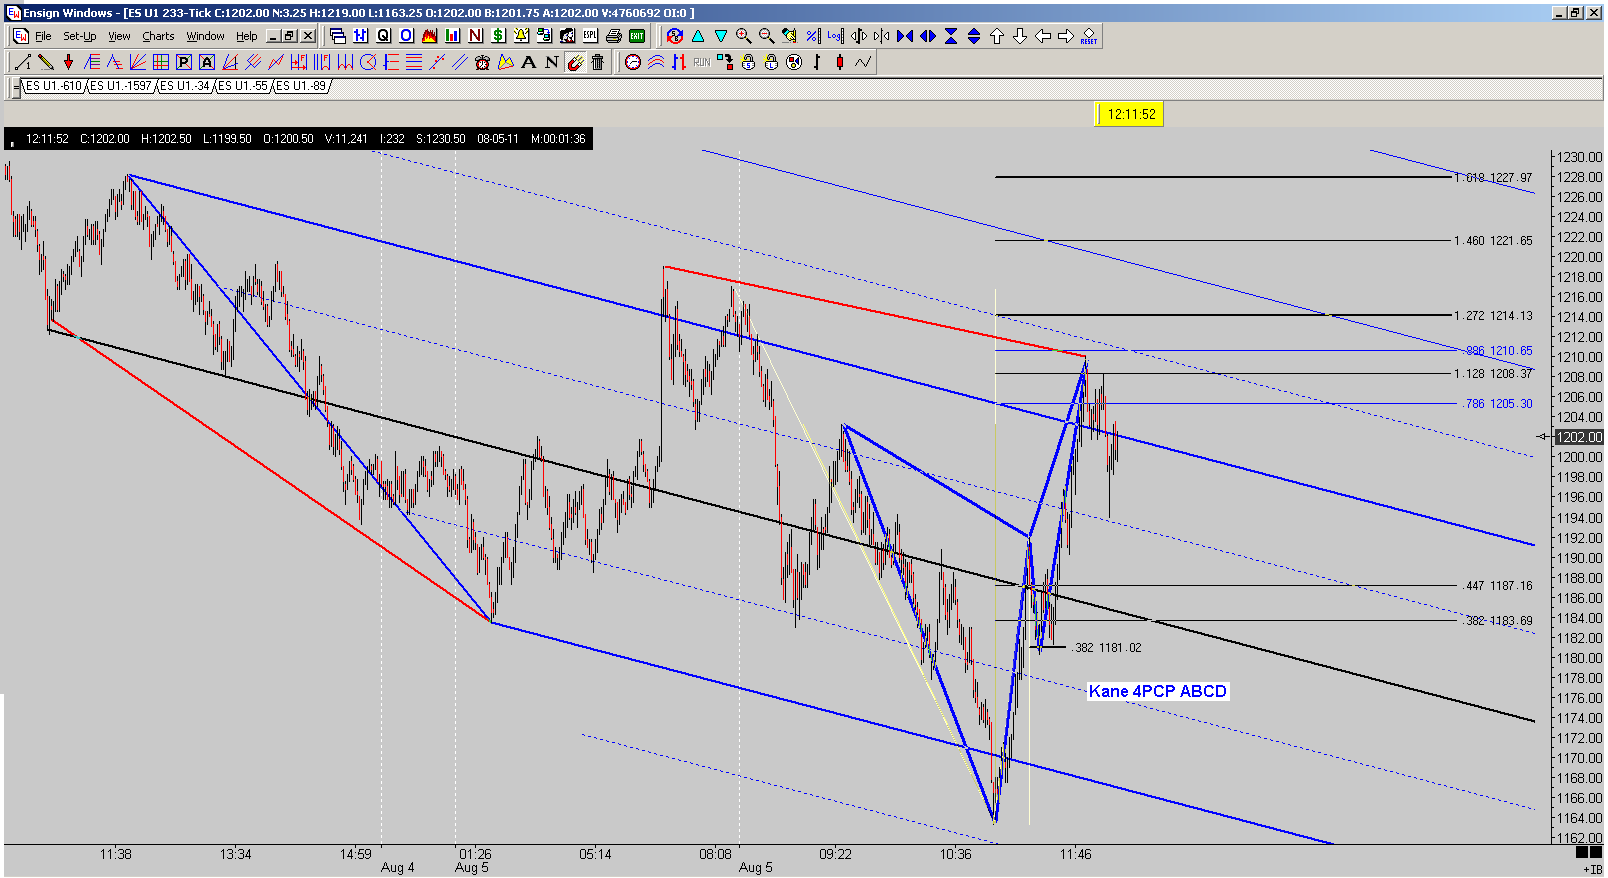
Hard to believe it would bounce up from that shakeout, to a key .447, and drop some 55.75 points off there, right to my posted level. Low was 63.25. Area posted was 55-70. Area goes back to at least 2008. Point A to point B. Then it bounces 47 points off the area, to the .447 off the same starting swing as the last one. Point A to point B. Eazy-peazy.
Originally posted by jimkane
And there's a new low for the move. I didn't think it would have the juice, and so far it hasn't had it. But, is that the shakeout I mentioned? I'm not getting the best confluences anywhere coming up on the downside on the higher timeframe, and I'm wondering what that is telling me? I have some key Fib related stuff right here, but the two critical, key lines are below in the general areas of 1170 and 1120.
It's hard to pinpoint the spots because the Fib and other stuff are arrayed over a wide area. The .382 off the 2009 low is at 1103. The .300 is at 1161, and I have another super-key line around 1155, so, given this goes back over years, the area is about 1155-70. That's not that wide for that big of a timeframe. But, alas, there are things I like to see in a confluence area, and many are not there.
I'm really thinking this could try for a lower area (not necessarily straight down) around the .447 which is at 1057. If I get the time and energy I'll post my 'doomsday' deflation scenario on the weekly $SPX chart. I don't see it happening, but it is cool enough to at least look at. So, for now, and I'm tentative on these levels and may refine or change them later, here they are:
Watch right here at 1188-89
1155-70
1120-30
1057
I am also open to an implosion scenario if the repo or money market freezes up, which could happen any second. This thing is flirting with doomsday issues that the Fed couldn't even begin to touch with all the money it could digitally print. If any of them happen, we could see downside previously unimaginable. Seriously.
JI
jimkane
Rep: 3,058
Posts: 33,089
Okay, here's my fantasy. It isn't going to happen, but I can dream, huh? They panic sell this into the close and it hits my next level at 1120-30. If one is going to dream, one might as well dream big.
JI
jimkane
Rep: 3,058
Posts: 33,089
In the meantime, for the realists, watch this KZ in here for clues on how serious these paltry sellers in here may be.
AL
albert
Rep: 99
Posts: 3,094
Originally posted by tx_ches
Great job, Al. You caught a lot more things. You are good at drawing the SL. I particularly missed 2 even after drawing 1 and 3. You also caught many more .886. I particularly like your 6.
I thought this was a great exercise on how well the tools can work near a turn as joed has said. For myself, it also showed me that I had made some progress with the tools since the last time roofer gave a list of charts to try them on.
For the record, I did try Jim's two recent detailed postings on action, levels, and turns but gave up in frustration. I never know with his stuff if he means 240 min or 3 min.
Thanks, tx. I spend probably too much time looking at the smaller details and not enough scoping out the "bigger picture," like the turquoise line 4. Kane TD ABCD. That is a good one. I looked at your work and picked it up right away. I do not know if I would have seen it by myself. I need to spend more time looking at larger as well as smaller timeframes for larger Kane ABCDs and structure. Many times I have been mentally involved in a smaller scale pattern, and missed an easy, larger Kane ABCD. This work requires a lot of expertise. Please keep up the good work.
Thanks, roofer, for the invitation for us to try our hand at your techniques on the SLV chart. I am sure there are a large number of things that I missed.
Thanks, Jim, for hosting this forum and sharing your thoughts. There is surely a lot of your work that I don't "get," but I am working on it.
Good Trading,
Al Kamego