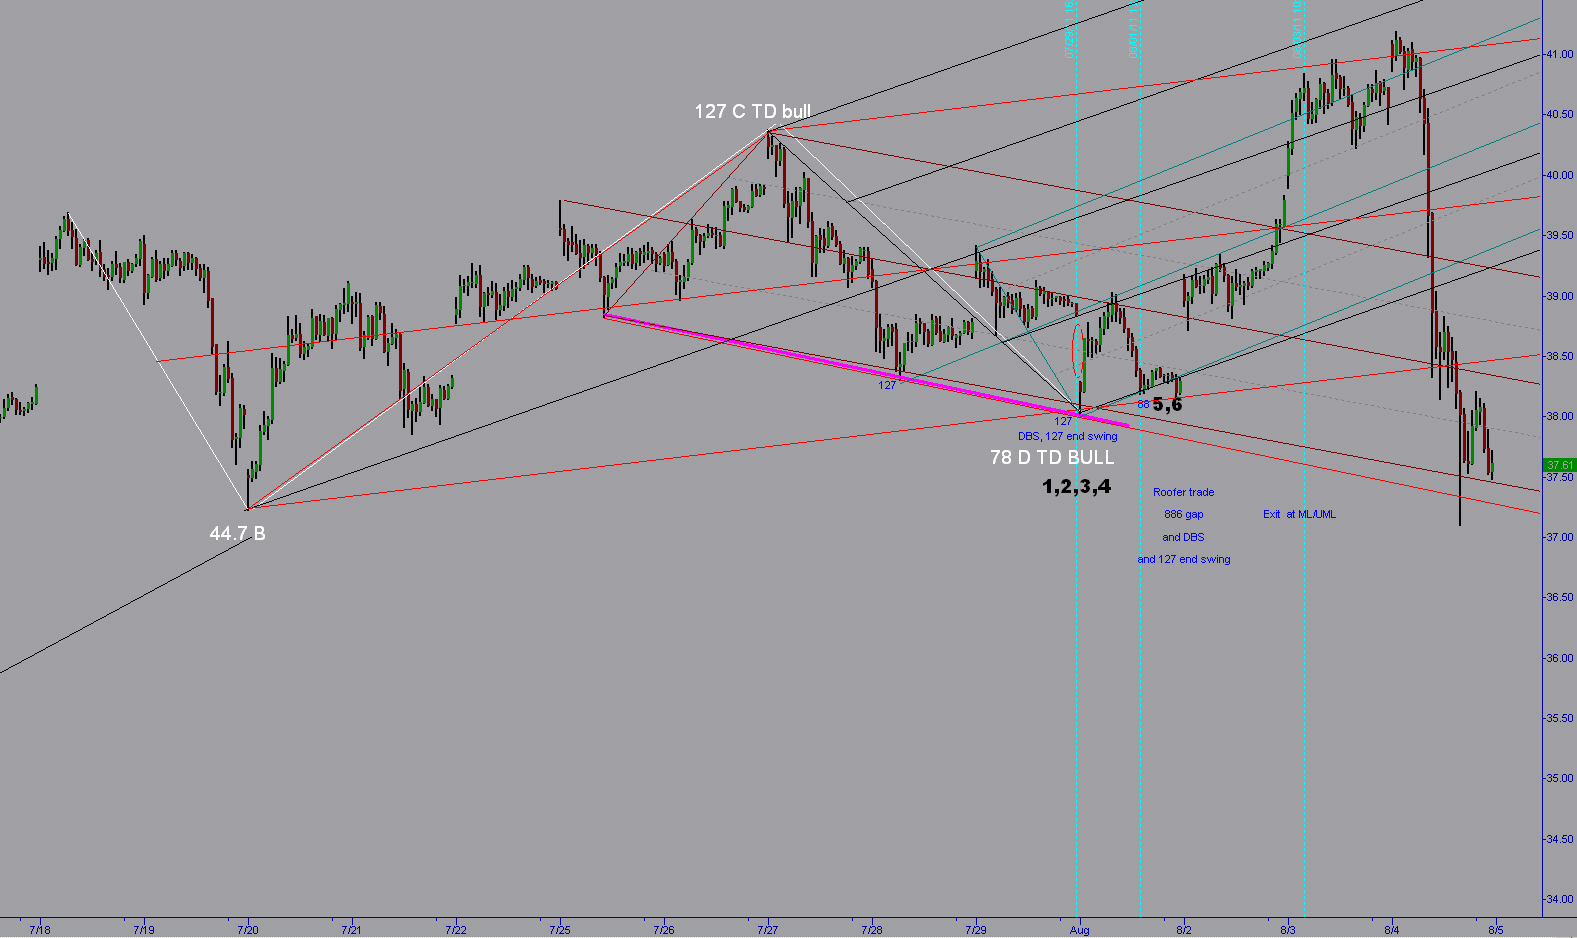
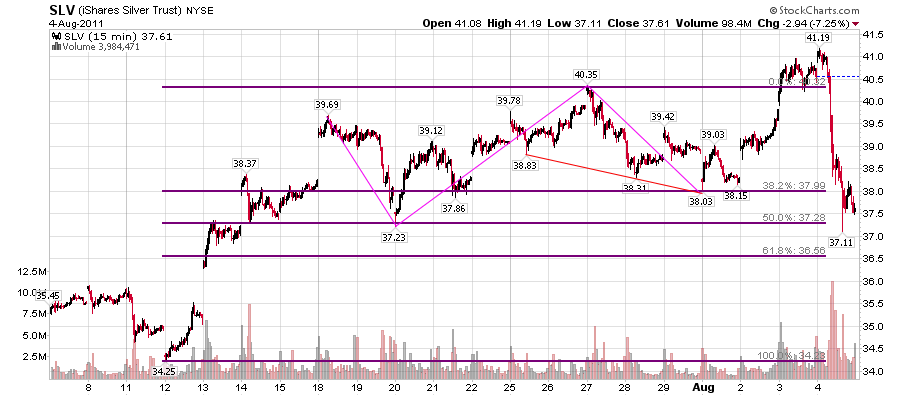
Roofer said 15 things could be found for silver setups recently. I'm using SLV 15 minute charts in all of below. I have not looked to see what Rat, or anyone else may have come up with. This is my own work except Roofer started us off with some sets, an ABCD, and some .886 markings.
Points 1-6 describe the setup for a long trade on 8/1/11. Price went to uml of multiple sets on 8/3/11.
The 15 minute chart for points 1-6 has 4 sets: brown, black,red (schiff), teal.
The ABCD is marked in white and came from roofer. I think all the sets originally came from roofer or are very close to his.
1. Shown on 15 minute, you have a TD bull with b at .447, c at 127, d at 78, completing at lml on 2 different sets.
2. You have the dbl 127 end of swing at same point.
3. You have 3 touches along a line that is very near the lml. I colored the line thick magenta.
4. You have a measured move. Using the labeling on the ABCD, you have AB down leg = CD down leg - almost. It as between .886 and 1.0.
5. You have the .886 on gap retesting the lml of 3 sets.
6. After the .886, you have another retest of the low.
TX
tx_ches
Rep: -10
Posts: 514
Yeah, I wondered about the gap up too. But your use of the tools was one of the most fantastic things I've ever seen.
Originally posted by roofer
for a brief moment this morning my condition had me despairing
RO
roofer
Rep: 3,689
Posts: 3,574
ches- you want to get to the point where what today seemed fantastic is something you see at least 2 or 3 days a week in a boring tradable manner.
TX
tx_ches
Rep: -10
Posts: 514
Yes. But you have to be looking at the right stocks/etfs. I don't know how you and rat do it. If I try to track more than about 10, my brain freezes up and I see nothing. Maybe I'm looking at too many timeframes every single night. I look at 8 timeframes. So if I try to track 10 stocks, that's 80 charts I'm looking at and marking up at night. And you track 40 stocks. How can you get that many done?