Welcome back everybody! I just returned from my longest holidays in many years. And it looks like the best trading action of the year started just after I left and lasted for whole that period... Coincidence? :-)
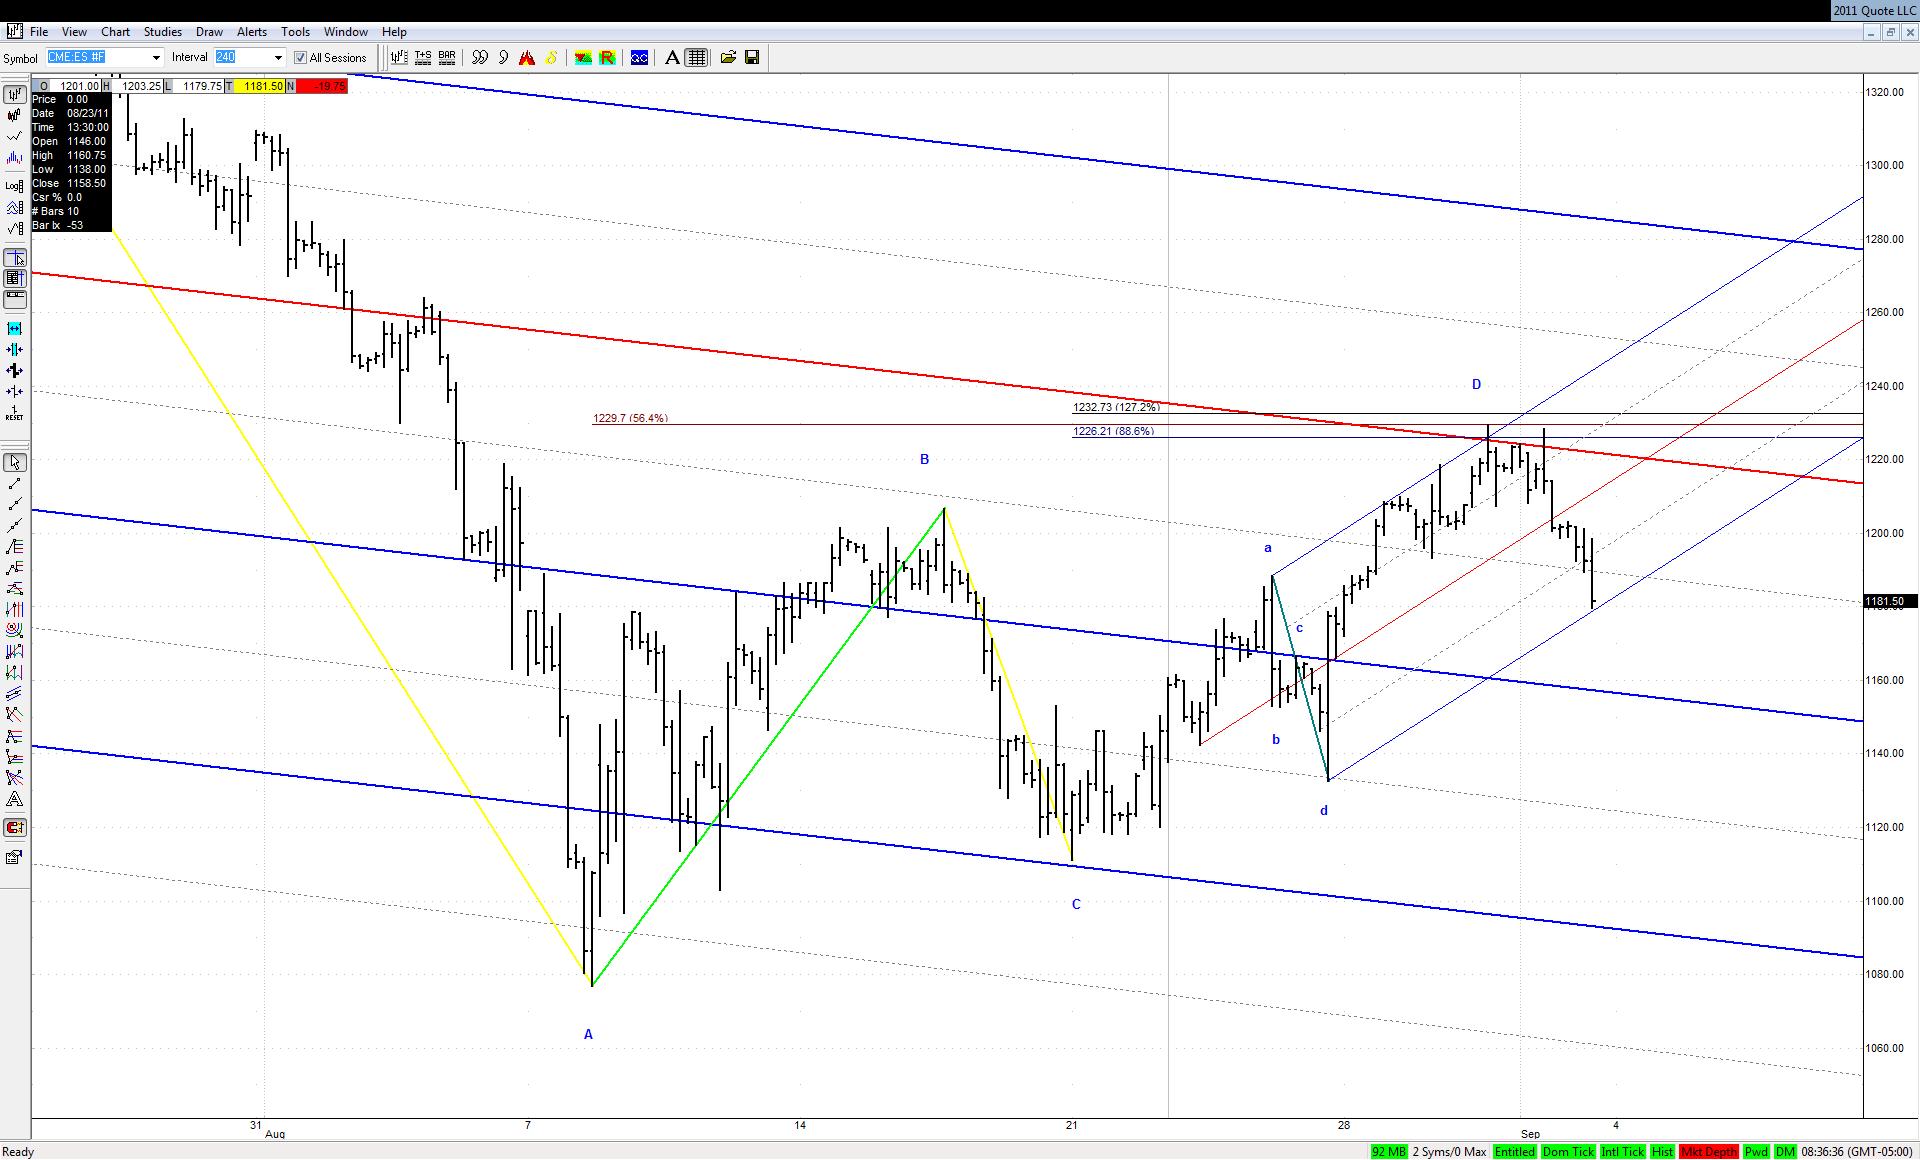
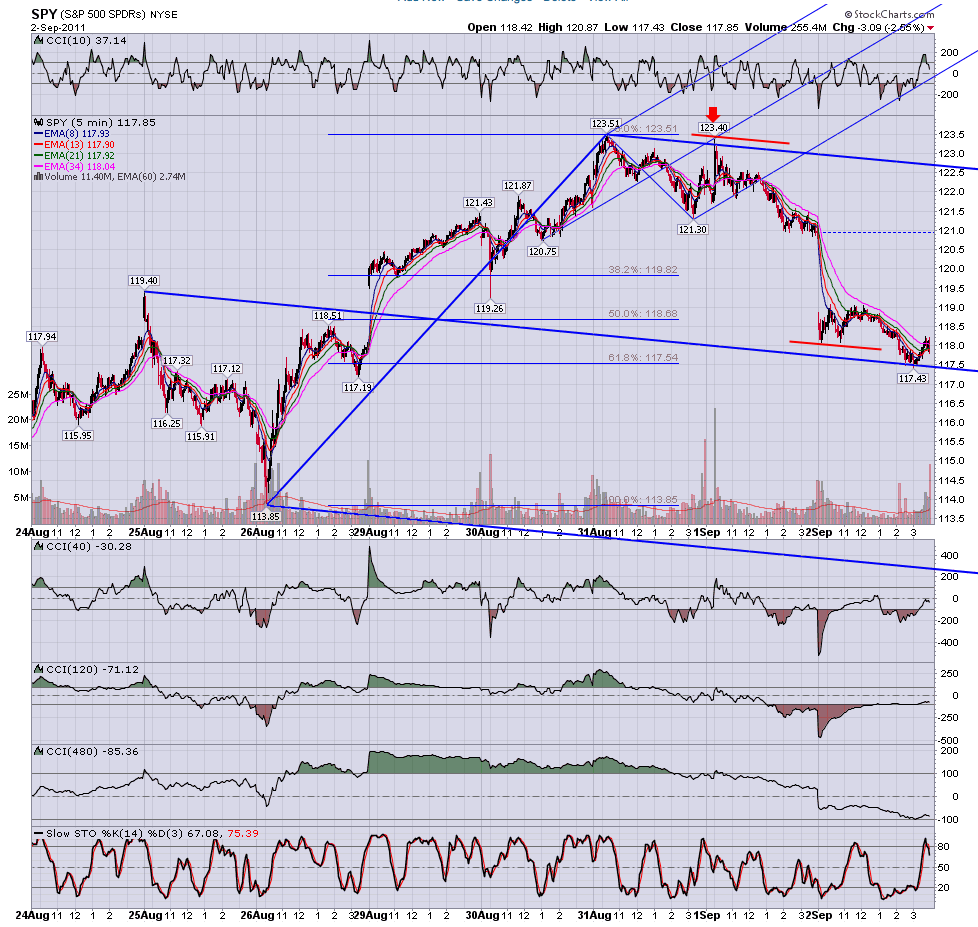
Fortunately charts tell us, that it should last for at least some time to come:
JA
jarek
Rep: 94
Posts: 3,474
Originally posted by jarek
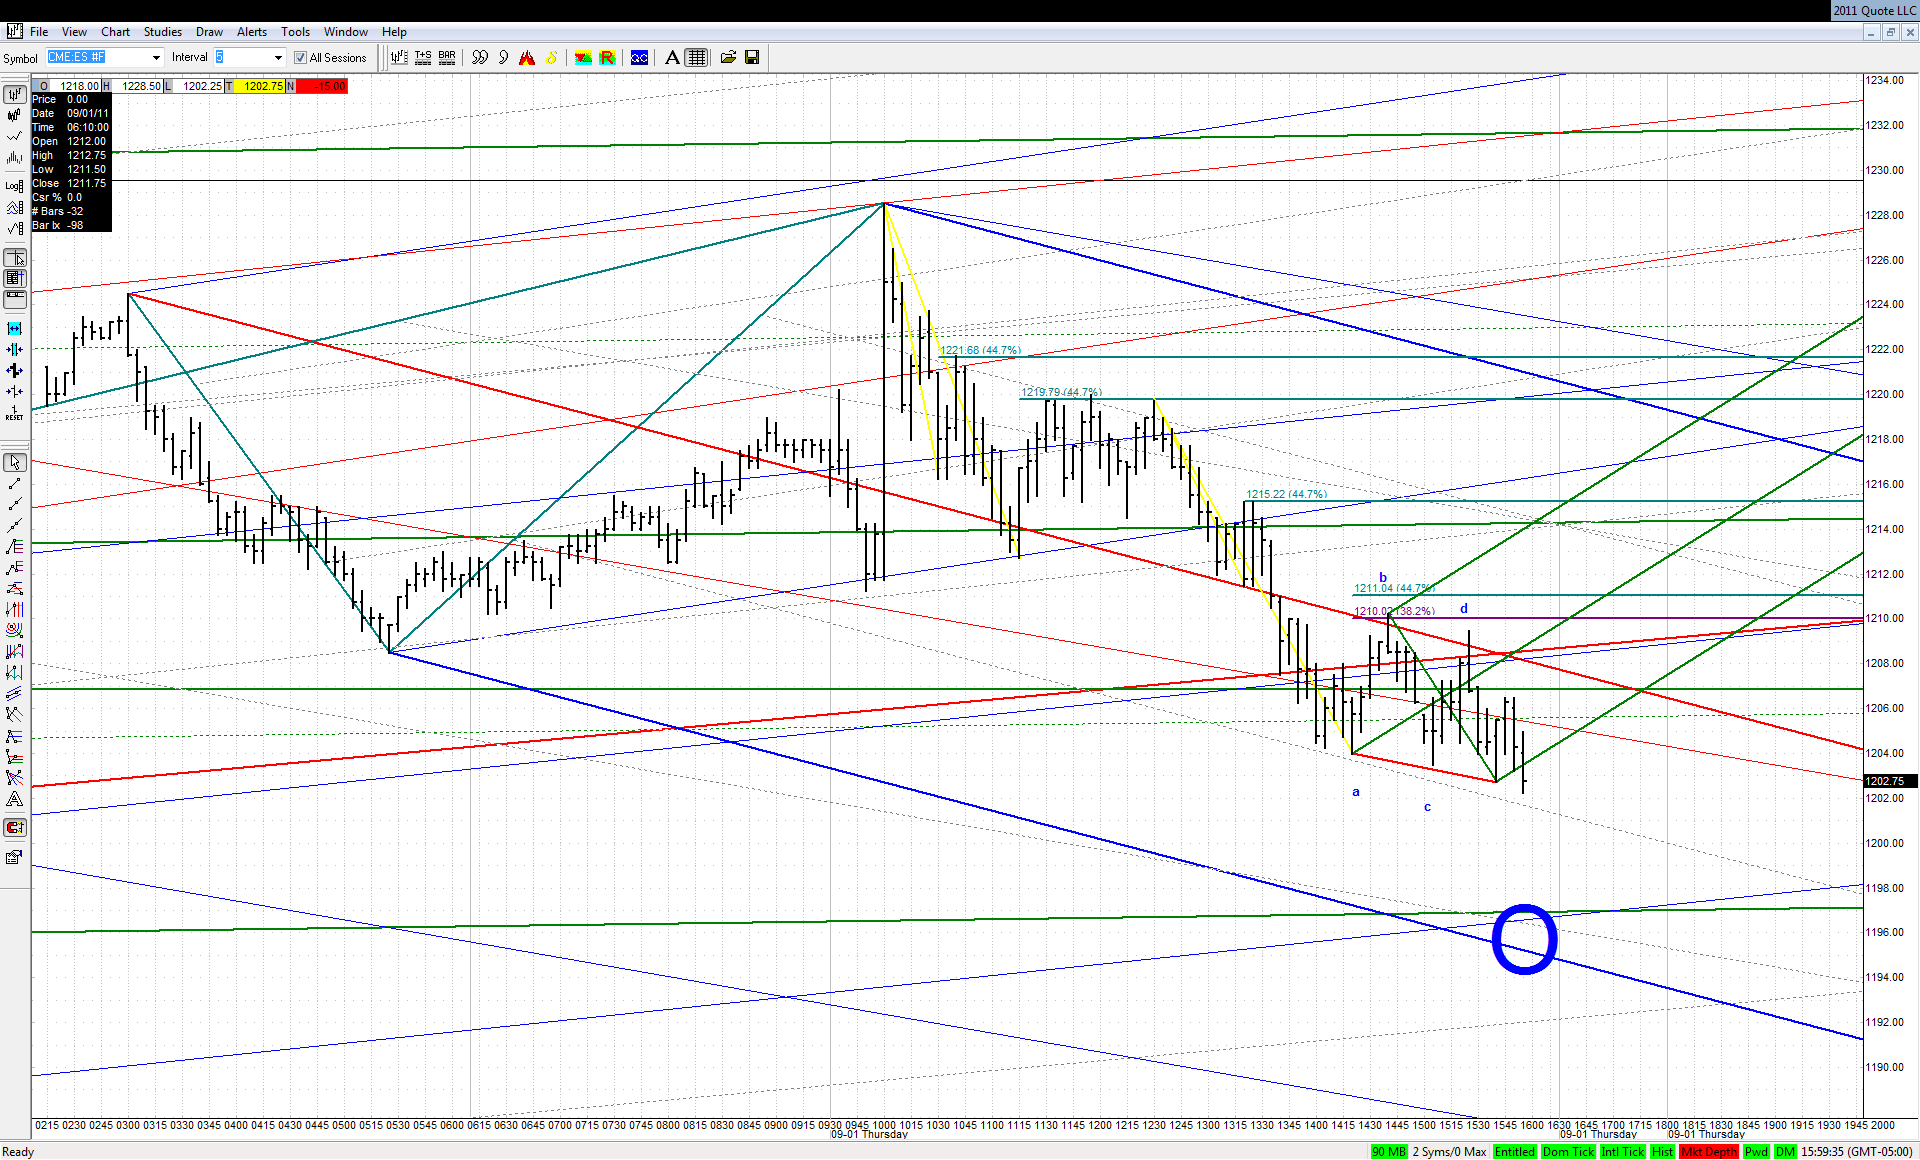
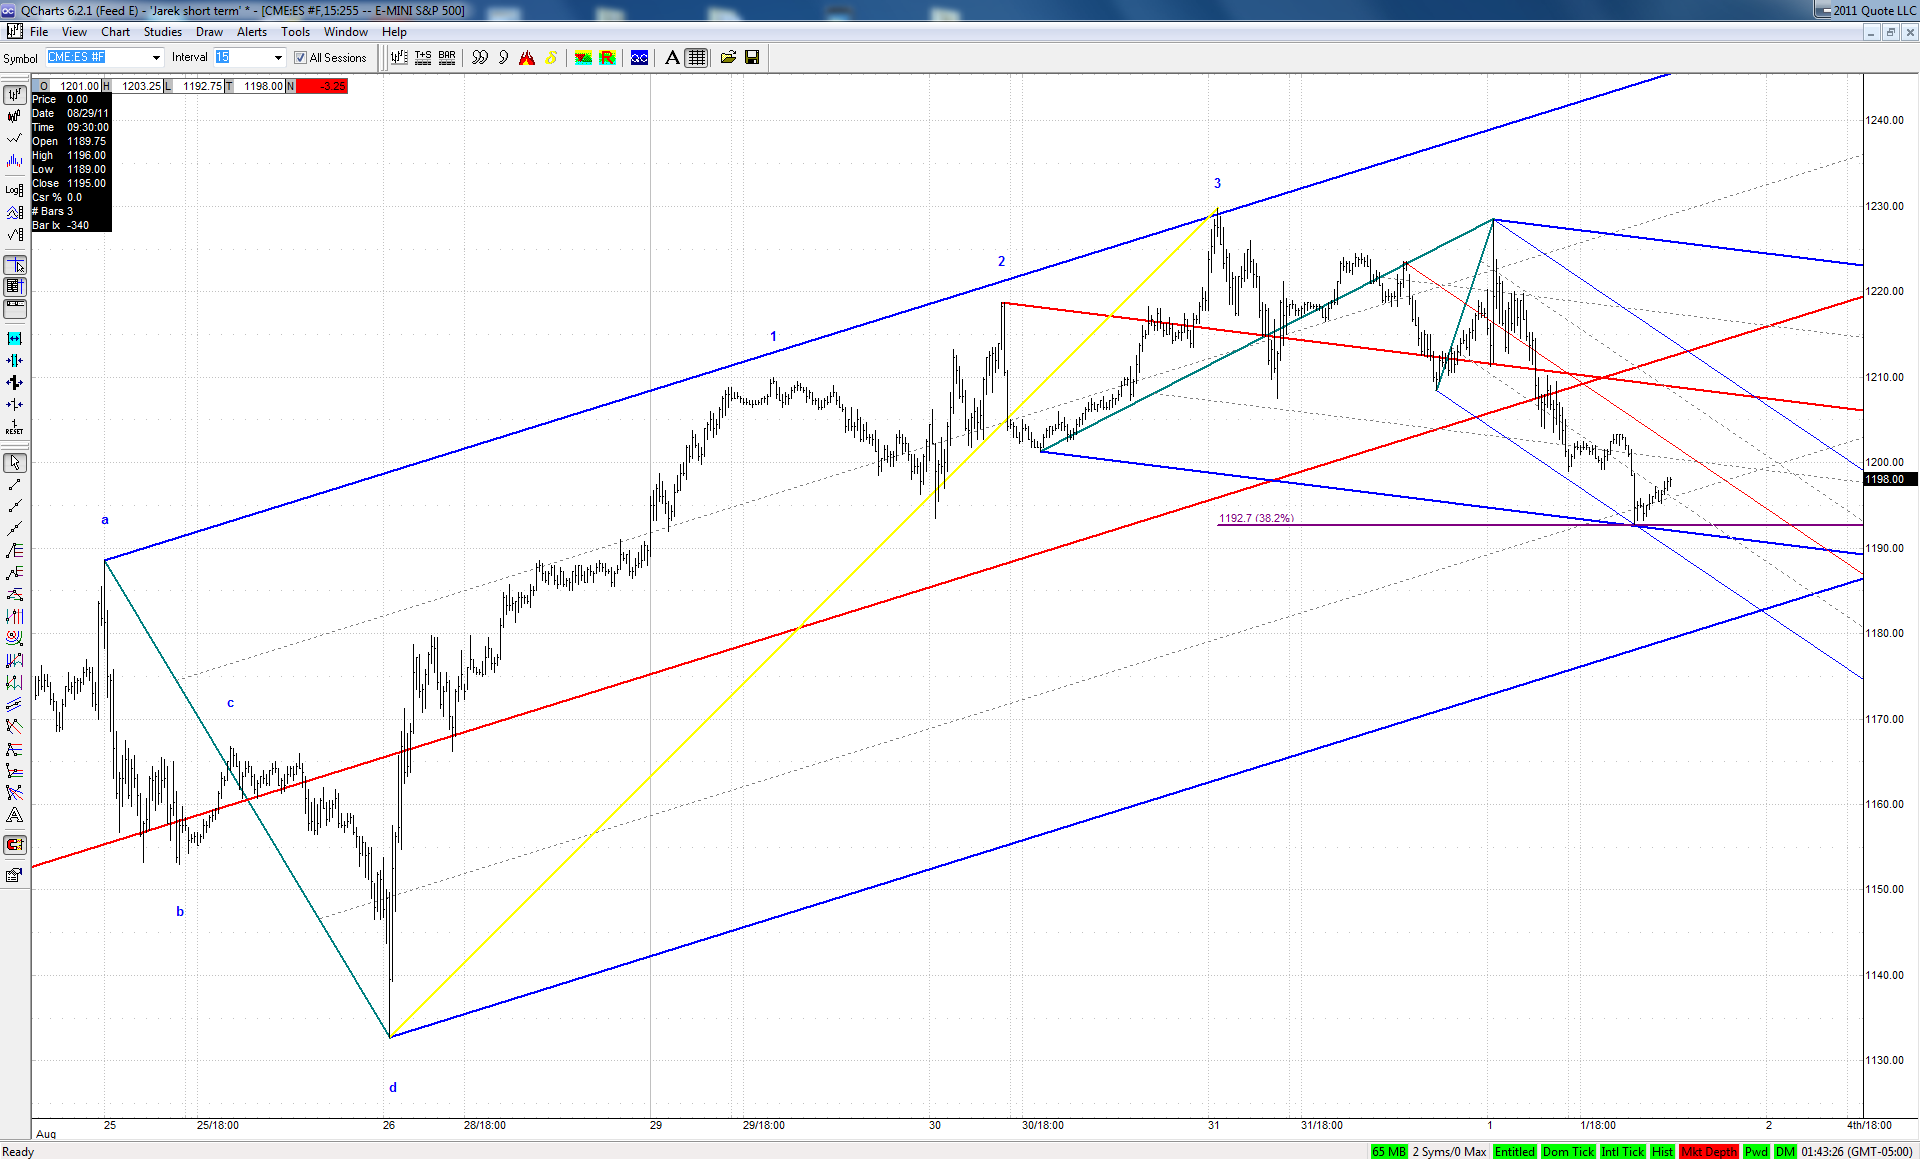
...Looks like computers recognized 3D at a spike line:
Failure to reach the green line in a situation like this tells the story for the day:
Click image for original size
JI
jimkane
Rep: 3,058
Posts: 33,089
Funny, though, they go through the SL, again, and bounce it right back up. Very curious, how many times they gamed this, with no resolution, not even in the after-cash. They close cash right at the critical spot, after so many tries. Very, very curious.
JI
jimkane
Rep: 3,058
Posts: 33,089
Well, we got some last minute 'drop-age' there going into the after-cash close.
JI
jimkane
Rep: 3,058
Posts: 33,089
I wonder if they really will shut the bots down. Somehow I really doubt anything will change. Ever (well, I mean until the complete collapse happens).
http://www.zerohedge.com/news/goodbye-high-frequency-trading-regulators-seek-secret-hft-codes
http://www.zerohedge.com/news/goodbye-high-frequency-trading-regulators-seek-secret-hft-codes
RO
roofer
Rep: 3,689
Posts: 3,574
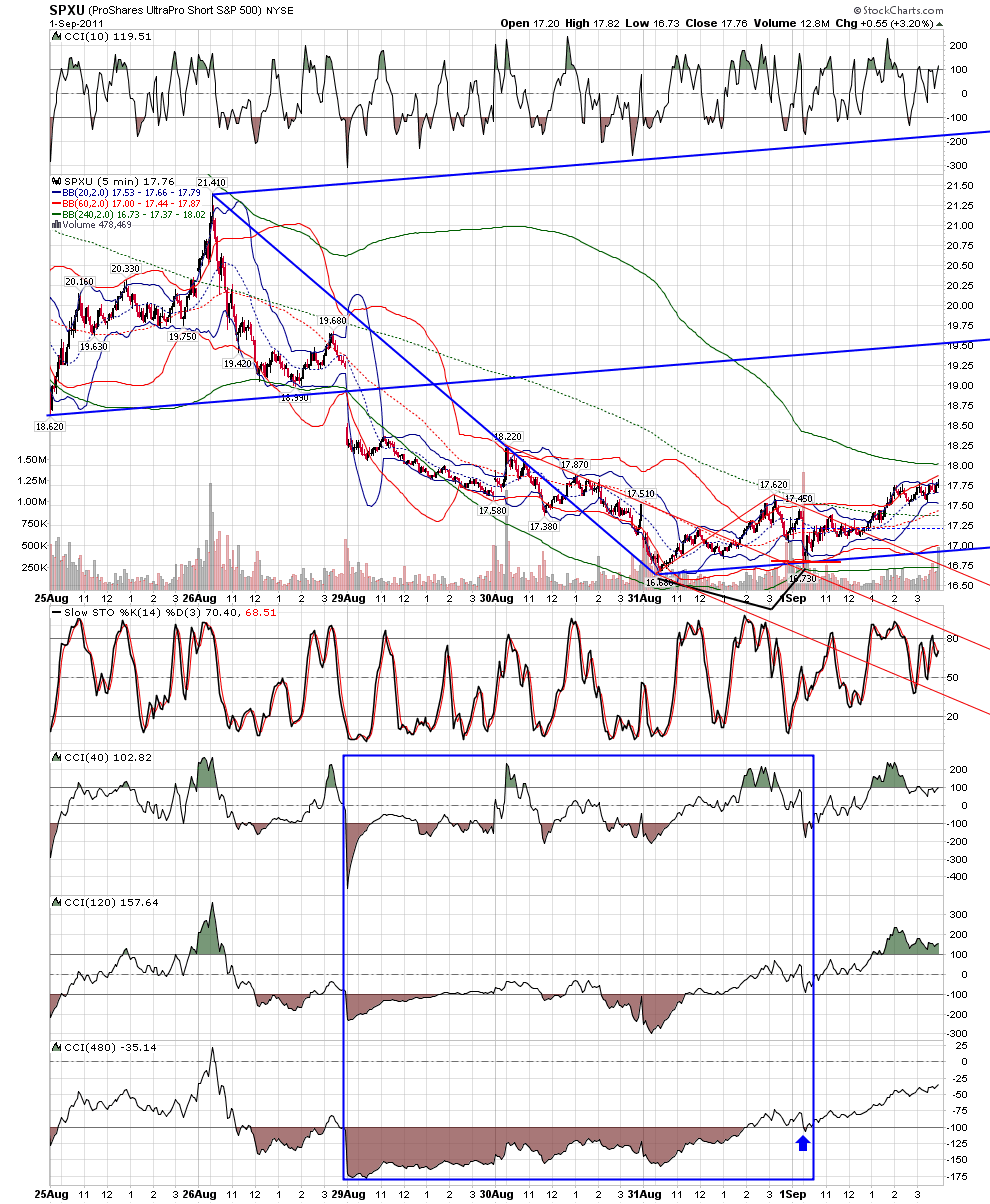
discouraged- just because i asked no one to comment, i did not mean dont read.the setup in the SPXU was the same as i showed in CDE yesterday.and look at the indicator setup.... very very similar to the ideal i have been showing in recent weeks.....forget the high frequency traders! our tools capture the intent of the computers programmed to capture the swings.... the computers already knew how they were going to react to the report, no matter what it said.... elsewise there would be no geometry that they recognized. all the billions of price movements prior to the report were created to setup the specific geometry... if they were not.. then you tell me why it spiked to exactly where it did then went no further....rat .. you had it right on your chart.... but remember, the computers aree rarely using the SPY any more to show intent.... go back to the posts from april 2010... it was easy back then....how it takes more concentration and more acceptance of the computers control.
Click image for original size
JA
jarek
Rep: 94
Posts: 3,474
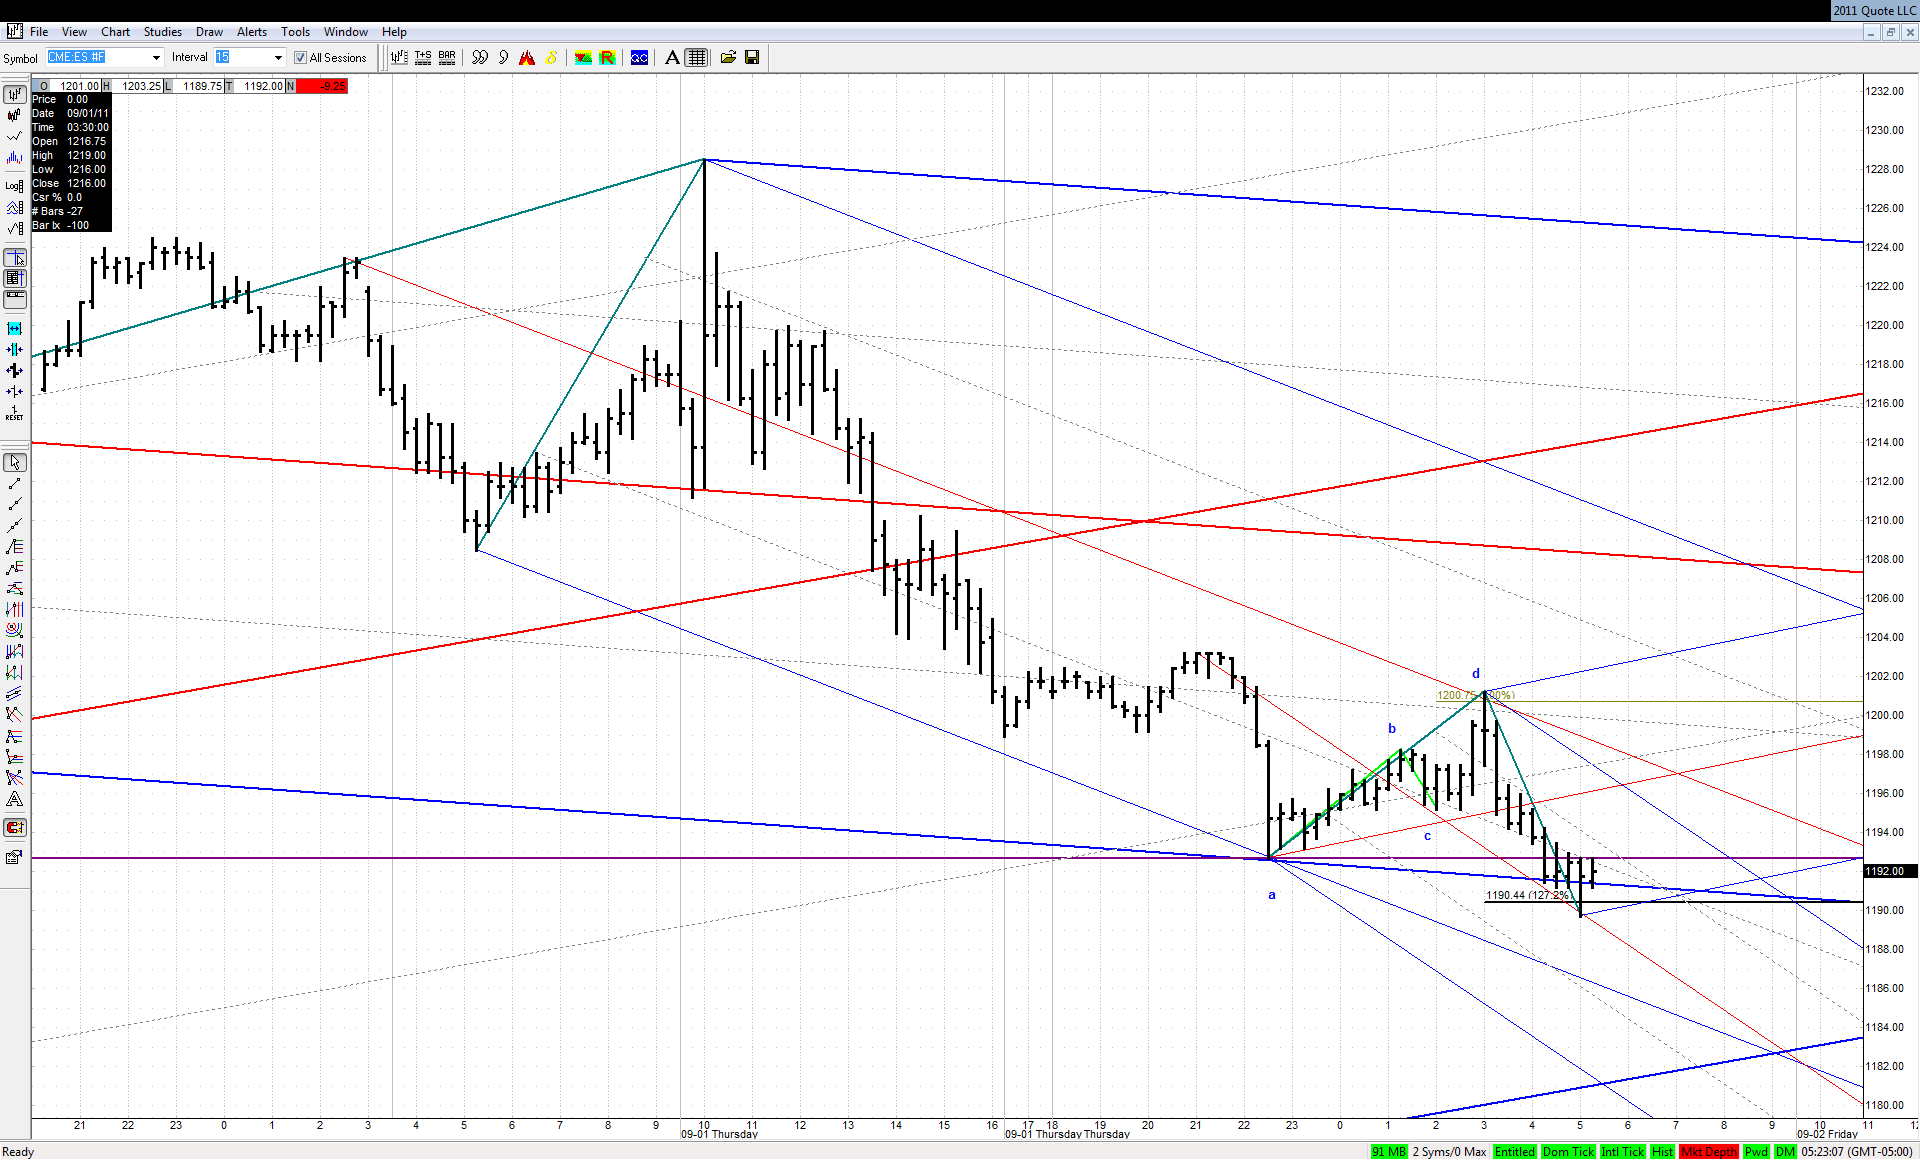
One more new low right at 1.272 off a 1.000 bearish abcd:
Was this a final shakeout in this 40 points move down?
Click image for original size
Was this a final shakeout in this 40 points move down?