ES Wed 8-31-11
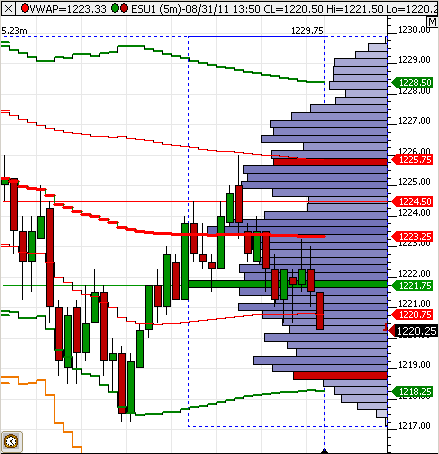
The following chart is from Tuesday's market action. No single prints created or hit. The VAL was almost a buy price but the market didn't quite hit it.
Click image for original size
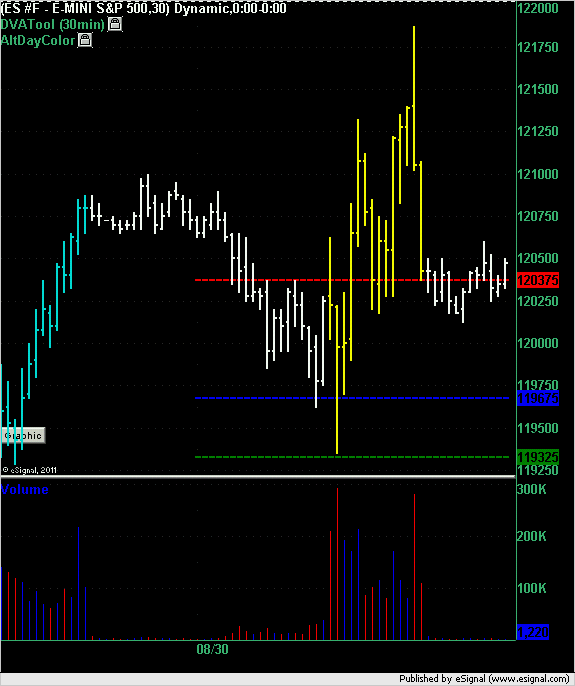
all 3 markets trying to bust out of yesterdays highs and may trap many shorts...what would you do if you sold that area and then the market came back to it...? U would buy to get out which would add to the buying pressure...so that is the obvious point to watch.....failure off those highs will target the low volume from O/N at the 1211.25 - 1212.50 area..... Lots will be trying to buy near here.
If we accept price above YD highs then the 1229 - 1230 becomes an area of interest for me.
Below the 1211 area is the 1206 area...
Good luck today..
If we accept price above YD highs then the 1229 - 1230 becomes an area of interest for me.
Below the 1211 area is the 1206 area...
Good luck today..
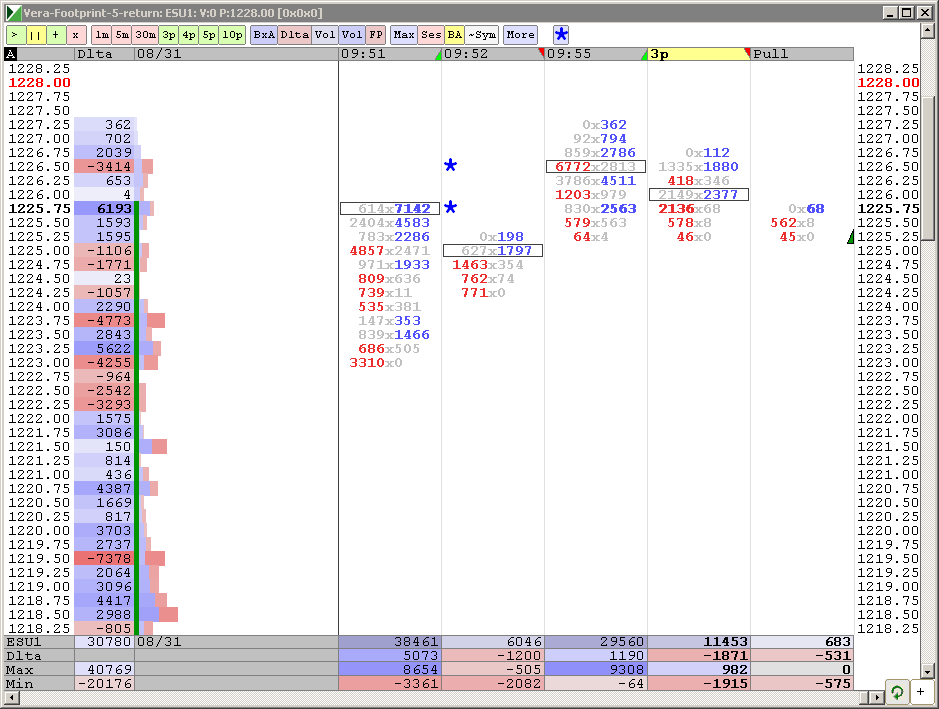
starting my hunt for shorts above 1226 ...there is low volume at 1222.75...
Report in 6 minutes....
First Volume
Click image for original size
maybe pre-report - traders lighten up. Thanks for the reminder Bruce, I lost track of time
Volume
Click image for original size
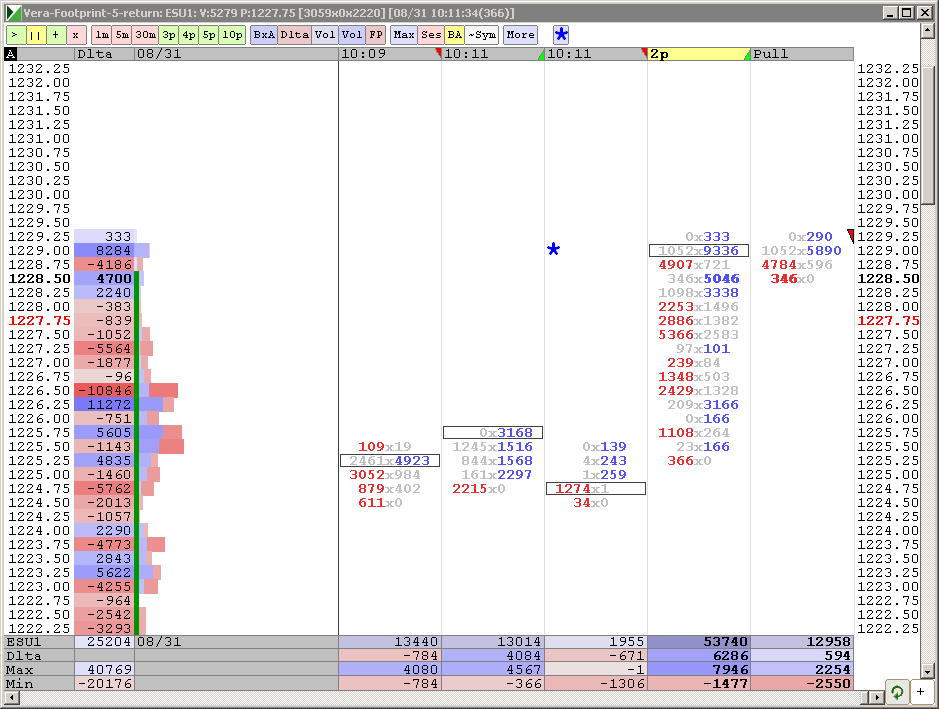
I will short below that level
Click image for original size
small stop
around 1241 is a better short
1229 target hit-see Monday posts
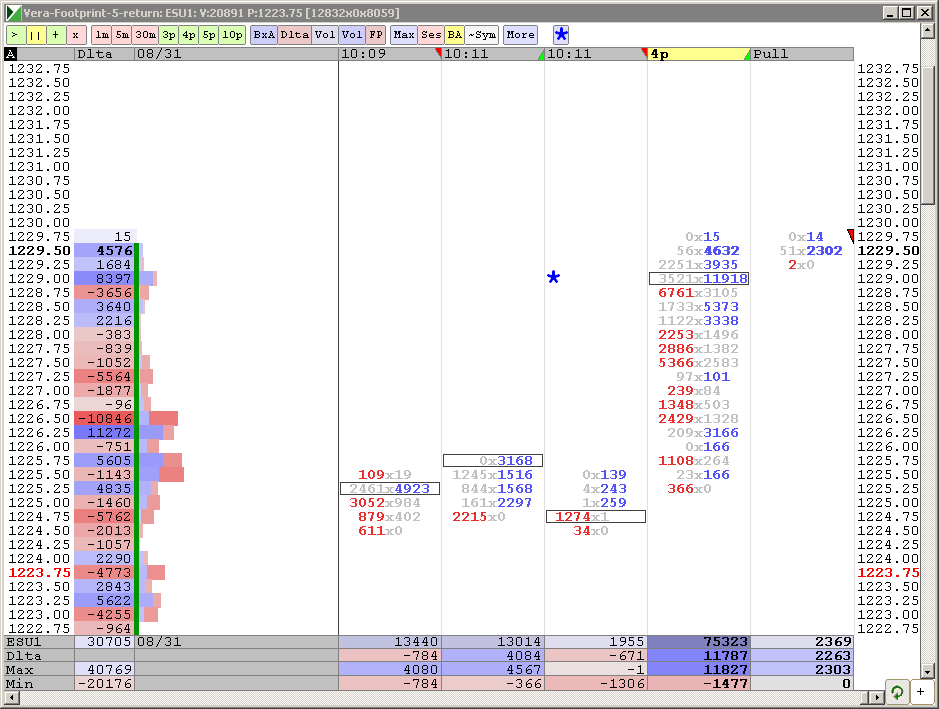
can go to previous low at 1236 area(or higher to daily 50 sma)
no sharp reaction yet
would use 1229 as pivot if exceeds
divergence is negative here
can go to previous low at 1236 area(or higher to daily 50 sma)
no sharp reaction yet
would use 1229 as pivot if exceeds
divergence is negative here
Sorry, today fingers are faster than brain and I put up wrong chart. Here is the chart I wanted
Click image for original size
Emini Day Trading /
Daily Notes /
Forecast /
Economic Events /
Search /
Terms and Conditions /
Disclaimer /
Books /
Online Books /
Site Map /
Contact /
Privacy Policy /
Links /
About /
Day Trading Forum /
Investment Calculators /
Pivot Point Calculator /
Market Profile Generator /
Fibonacci Calculator /
Mailing List /
Advertise Here /
Articles /
Financial Terms /
Brokers /
Software /
Holidays /
Stock Split Calendar /
Mortgage Calculator /
Donate
Copyright © 2004-2023, MyPivots. All rights reserved.
Copyright © 2004-2023, MyPivots. All rights reserved.