Monday 10-24-11
I'm hoping to expand on this as the weekend progresses and I have more time. My disclaimer here is that these comments and charts are only focusing on the bell curve ideas. These are not the only numbers I use or trade from. These comments are also made because we don't have volume to work from at the current prices from the current active contract.
One of the nice things about the emini is that even if you don't like this approach or using the cash market or the continuous contract for data then you can just wait until volume comes into the current contract. The emini does so much back and fill that you would rarely have to wait more than half a day to get better volume numbers.
My good buddy Lorn was kind enough to send some charts to me that I requested which in turn inspired me to fire up my old Investor R/t to have a look at some charts that I can post.
Nick asked about further numbers on the upside and I was unable to get to a response to him on Friday. This will cover some of that and some additional questions that were sent to me. Hopefully this won't seem too complex.
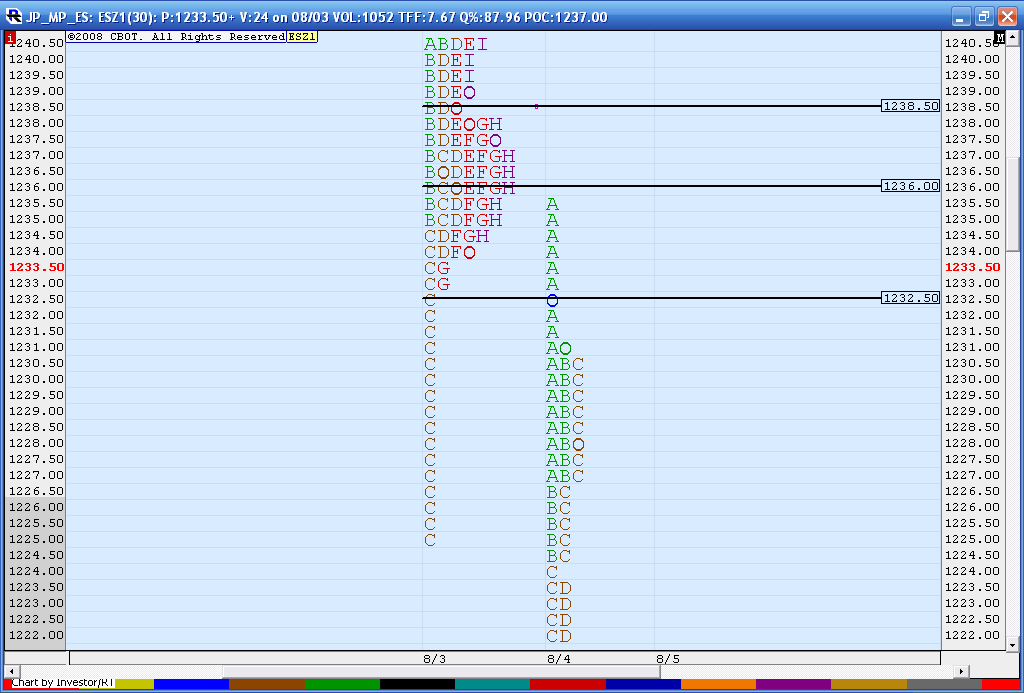
Below is a mini bell curve from part of 8-03-11 (day session only )and part of 8-04-11. Time can be used as an approximation to volume when volume is spotty and you are not comfortable with your "read" on a contracts volume. Normally I would be against using the time factor on it's own but when you have a good visual on the regular bar chart to confirm your time reading then it is a fair proximity. See bar chart down below.
So I have lines snapped at this mini bell curve from 8-03. I put lines at the low time tpo extremes but also at 1236 as that begins to define the high volume/time area of that particular bell curve. The BEST bell curves will also have a nice peak volum eline too. Look what happens on the following day - 8-04. We trade into the mini bell curve and reject it and sell off. This tells us that the 8-03 bell curve is still valid! You could then combine the 8-03 and 8-04 trading days into one if you cannot see this. Over time you will probably lose your need to combine the profiles.
I mentioned above to confirm your time based bell curves ( tpo charts) with your standard bar chart patterns too. Here is what the bar chart looked like from that day. The reality is that 41.25 actually captures the upper limit of the bell curve much better. The TPO chart does not capture the bulk of the volume/trading effectively. See how resistance becomes support at a price of 41.25 ? This happened at 2:30 in the afternoon for reference. This to me encapsules the bulk of trading better.
So the upper limit I feel should really be up at 41.25 and not the 38 area. This is a great example because it is something we should look at anyway everyday and not just pretend that the volume bell curves are the holy grail. They fundamentally are really just consolidation points seperated by low volume. This upper bell curve will be the key to continuation or a decline on Monday. Can they keep trade above it to ensure a further rally or will they get back below the lower edge and sell off?
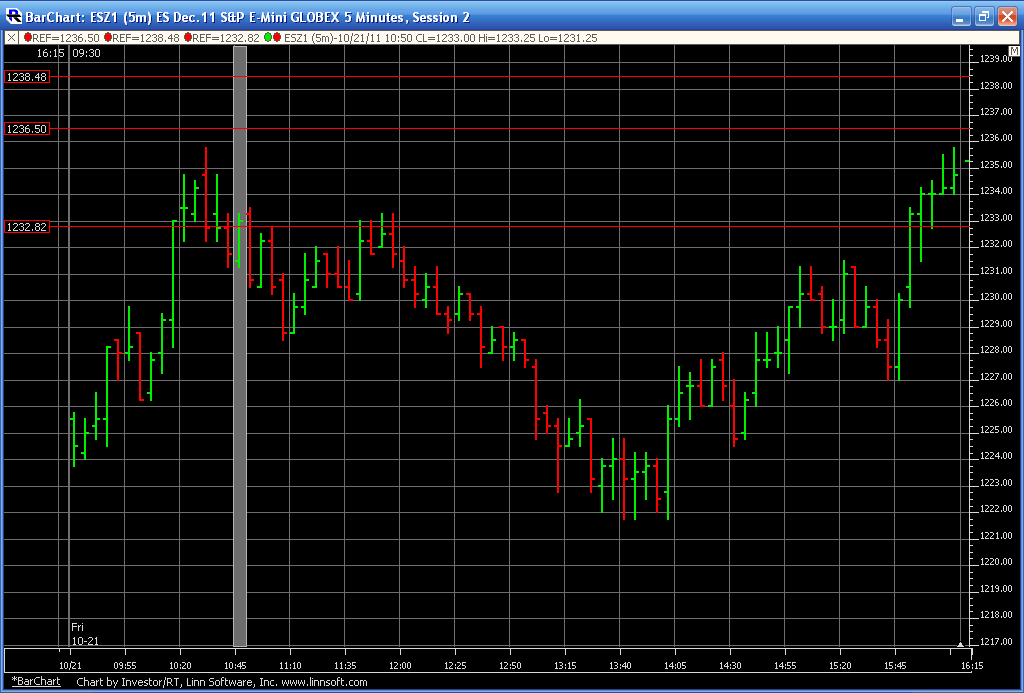
So now on this next chart I have taken those lines and put them on Fridays trade bar chart as this was/is the nearest bell curve as we went higher. Now some can see why the hour breakout with an air pocket below was a very good trade on Friday. Everything in context!
One of the nice things about the emini is that even if you don't like this approach or using the cash market or the continuous contract for data then you can just wait until volume comes into the current contract. The emini does so much back and fill that you would rarely have to wait more than half a day to get better volume numbers.
My good buddy Lorn was kind enough to send some charts to me that I requested which in turn inspired me to fire up my old Investor R/t to have a look at some charts that I can post.
Nick asked about further numbers on the upside and I was unable to get to a response to him on Friday. This will cover some of that and some additional questions that were sent to me. Hopefully this won't seem too complex.
Below is a mini bell curve from part of 8-03-11 (day session only )and part of 8-04-11. Time can be used as an approximation to volume when volume is spotty and you are not comfortable with your "read" on a contracts volume. Normally I would be against using the time factor on it's own but when you have a good visual on the regular bar chart to confirm your time reading then it is a fair proximity. See bar chart down below.
So I have lines snapped at this mini bell curve from 8-03. I put lines at the low time tpo extremes but also at 1236 as that begins to define the high volume/time area of that particular bell curve. The BEST bell curves will also have a nice peak volum eline too. Look what happens on the following day - 8-04. We trade into the mini bell curve and reject it and sell off. This tells us that the 8-03 bell curve is still valid! You could then combine the 8-03 and 8-04 trading days into one if you cannot see this. Over time you will probably lose your need to combine the profiles.
Click image for original size
I mentioned above to confirm your time based bell curves ( tpo charts) with your standard bar chart patterns too. Here is what the bar chart looked like from that day. The reality is that 41.25 actually captures the upper limit of the bell curve much better. The TPO chart does not capture the bulk of the volume/trading effectively. See how resistance becomes support at a price of 41.25 ? This happened at 2:30 in the afternoon for reference. This to me encapsules the bulk of trading better.
Click image for original size
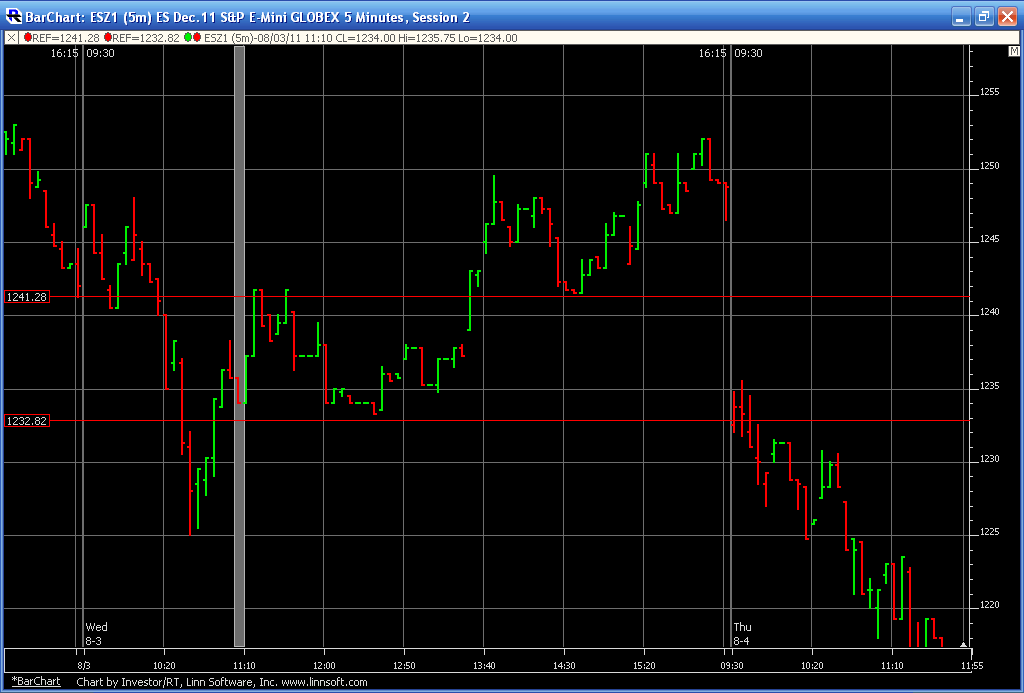
So the upper limit I feel should really be up at 41.25 and not the 38 area. This is a great example because it is something we should look at anyway everyday and not just pretend that the volume bell curves are the holy grail. They fundamentally are really just consolidation points seperated by low volume. This upper bell curve will be the key to continuation or a decline on Monday. Can they keep trade above it to ensure a further rally or will they get back below the lower edge and sell off?
So now on this next chart I have taken those lines and put them on Fridays trade bar chart as this was/is the nearest bell curve as we went higher. Now some can see why the hour breakout with an air pocket below was a very good trade on Friday. Everything in context!
Click image for original size
stopped on runners...cool example so far....the buyers would try to push for Lisas gap if they can and then the 52 - 53 area ( where I will look to sell again)...getting back under the 41 .25 number now will also have me start looking for sells again as that will be a failed break out of the upper bell curve from 8-2-11!!
I will let the buyers push it out if they can and will not take any longs up here and be patient..
I will let the buyers push it out if they can and will not take any longs up here and be patient..
INDU about to close its Aug 4 gap
This was cool because we had a type 1 opening as we opened inside the bell curve of 8-02 and then tried initially to push out the the Bhigh level from that day....having the overnight stop at the same level was/is a bonus..it is my opinion that is the reason the Overnight stopped there...anyone have any numbers at the 41 - 42 area...?
So waiting until the 41 level comes back or the 52 - 53 area hits is wise for me now. I'm always asking " are they accepting or rejecting a particular bell curve?"
So waiting until the 41 level comes back or the 52 - 53 area hits is wise for me now. I'm always asking " are they accepting or rejecting a particular bell curve?"
Bruce, Lorn, if possible, can you post that Aug 02 - 04) volume profile charts? when convenient!!
I still have not figured out how to go back after the contract rollover.
I still have not figured out how to go back after the contract rollover.

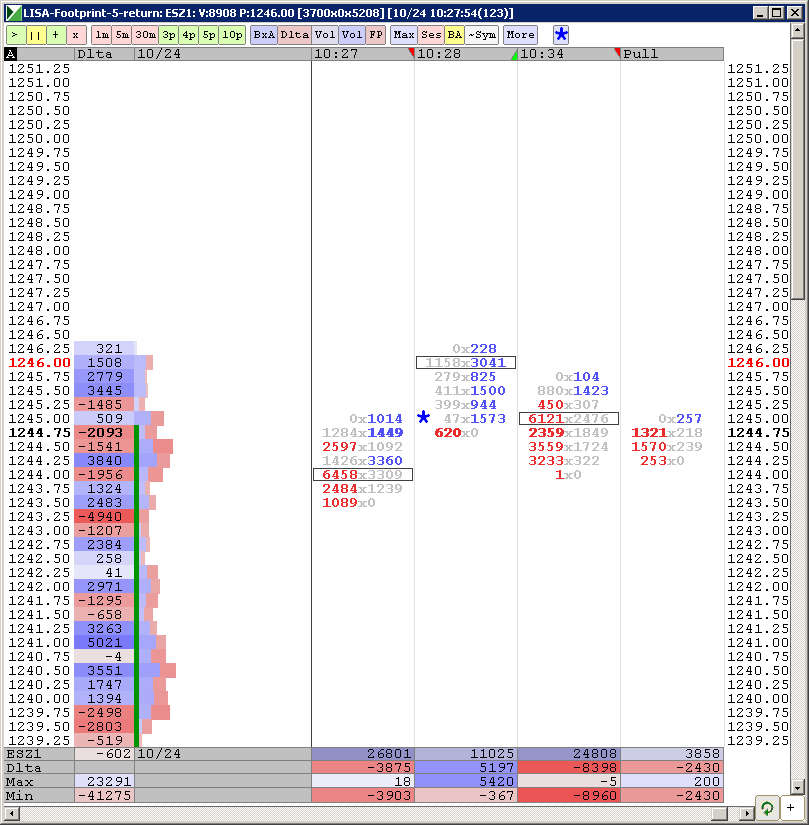
First wave of buyers got smacked, (see 10:34 column)
Click image for original size
Lisa i don't have my IRT fired up so can't post charts ..sorry...the volume is real poor as December wasn't the current contract for that time period anyway.....it probably won't help from a volume perspective too much...best to use time and then see if SOME volume is there..also include bar chart analysis
what I like if we can get below that 41 area is that so far they are unable to push and hold outside the hour highs so if we can get the short signal then they should push for those hour lows or at least get those air pockets I wanted for my runners earlier...
Looks like they ran out the trips
bruce im check my numbers for tomoroow
50.75 ,46.75, 42.50,36.75 ,28.25 how do they look to you LV
50.75 ,46.75, 42.50,36.75 ,28.25 how do they look to you LV
Emini Day Trading /
Daily Notes /
Forecast /
Economic Events /
Search /
Terms and Conditions /
Disclaimer /
Books /
Online Books /
Site Map /
Contact /
Privacy Policy /
Links /
About /
Day Trading Forum /
Investment Calculators /
Pivot Point Calculator /
Market Profile Generator /
Fibonacci Calculator /
Mailing List /
Advertise Here /
Articles /
Financial Terms /
Brokers /
Software /
Holidays /
Stock Split Calendar /
Mortgage Calculator /
Donate
Copyright © 2004-2023, MyPivots. All rights reserved.
Copyright © 2004-2023, MyPivots. All rights reserved.