MP Just Spoos
Felt that as the 2 markets had loads to say that for once would do them seperately.
Click image for original size
How do you measure the "power" of a tail? By the number of TPO's or by the height/range of it?
Not the question I expected. ! lol ! the question I expected was ho come I knew that Friday was going to be a washout day at least 2 days in advance if not earlier???? -
30 odd people looked at noone picked up on that???
To answer you question re Tail its a little subjective where the LDB is not published. ie non CBOT markets but the speed, volume, and yes the height of the tail in realtionship to everything else going on depending on whether its early late in the day etc etc.
Okay - I take the bait - How come you knew that Friday was going to be a washout day?
well if you look at the chart posted and scroll to the right and read at the top it was foretold right there before your eyes
Thanks Alex,
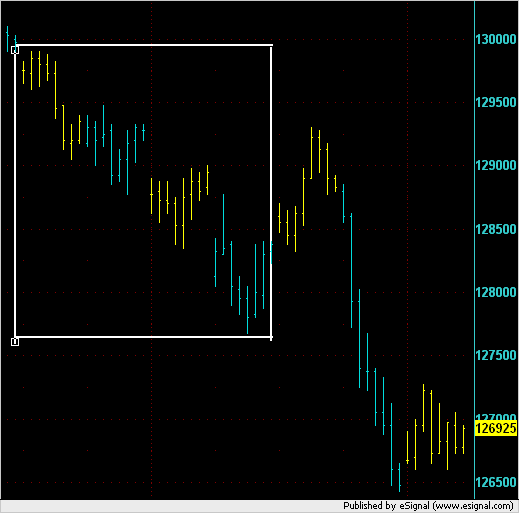
Here is a 60min RTH bar chart of what you posted in MP format above and below it are your comments. I'm doing this to try and get my head around your insightfulness by looking at it from another angle. The 4 days on your MP chart are inside the white square.
Here is a 60min RTH bar chart of what you posted in MP format above and below it are your comments. I'm doing this to try and get my head around your insightfulness by looking at it from another angle. The 4 days on your MP chart are inside the white square.
Click image for original size
quote:
A curiosity in that we have TPO buying all the way down hence why the market keeps on snapping back for the closes BUT VA is moving lower and not just lower but each day much lower since this thing started without anyone realising last Friday.
Look back if you do not believe me but it was already foretold on Friday. I'm sure many people will say 4 days down ... can't possibly do another ... well I say how about 5 days down then 6 days down and then Panic Friday capitulation for a trend week. (we went up for 7 days why not down for 7).
IF that is how it unfold then target is 1263.4 possibly 1250.2. If they go for a squeeze then 1292.3 - 1291.6 should cap the market leaving us with a range trade in a neutral week.
Click image for original size
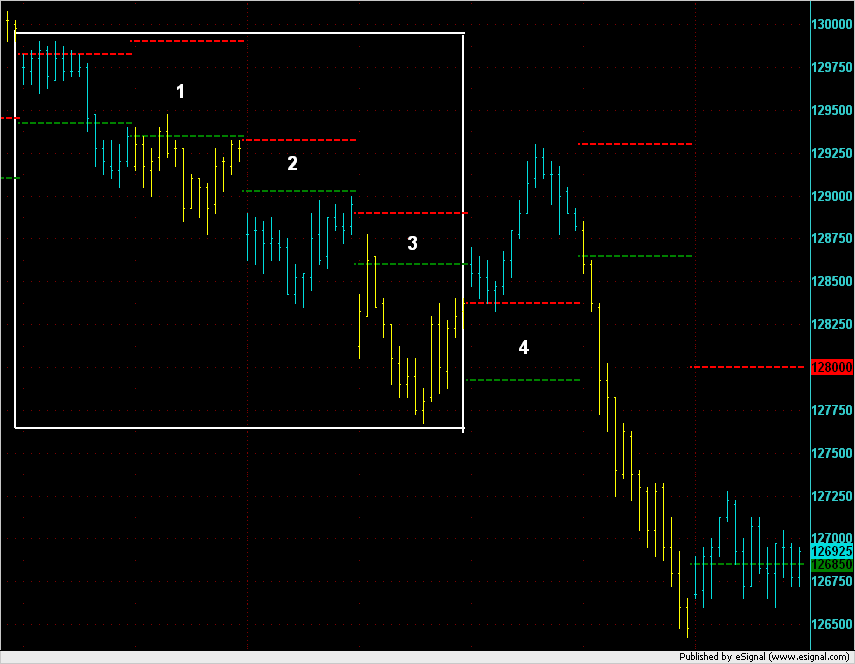
After posting that previous 60min chart I thought it would be better to do a 30min chart with the VA's on it as that would show in better detail what Alex was talking about. The 4 days VA's that Alex is talking about are numbered 1 through 4 on this chart. They show up on the day after each of the days traded but were created during the previous trading day and so those numbers are available for comment and analysis at the end of each trading day.
Good job Alex! - I'm starting to understand your way of thinking...
For simplicity I've excluded other lines from the last chart that I posted. For example I haven't plotted the Point of Control (POC) and have colored each day's bars alternately to allow you to see where one day starts and the other finishes.
Alex,
To some up what you are saying, is that value moved lower all week and price moved away from value on friday and corrected itself on tuesday to keep trending to the downside?
bsd
To some up what you are saying, is that value moved lower all week and price moved away from value on friday and corrected itself on tuesday to keep trending to the downside?
bsd
Yep. so now look at Jan 24 and lets see if I have been controversial enough. lol
Emini Day Trading /
Daily Notes /
Forecast /
Economic Events /
Search /
Terms and Conditions /
Disclaimer /
Books /
Online Books /
Site Map /
Contact /
Privacy Policy /
Links /
About /
Day Trading Forum /
Investment Calculators /
Pivot Point Calculator /
Market Profile Generator /
Fibonacci Calculator /
Mailing List /
Advertise Here /
Articles /
Financial Terms /
Brokers /
Software /
Holidays /
Stock Split Calendar /
Mortgage Calculator /
Donate
Copyright © 2004-2023, MyPivots. All rights reserved.
Copyright © 2004-2023, MyPivots. All rights reserved.