ES SRs and Fibs 11/09/11
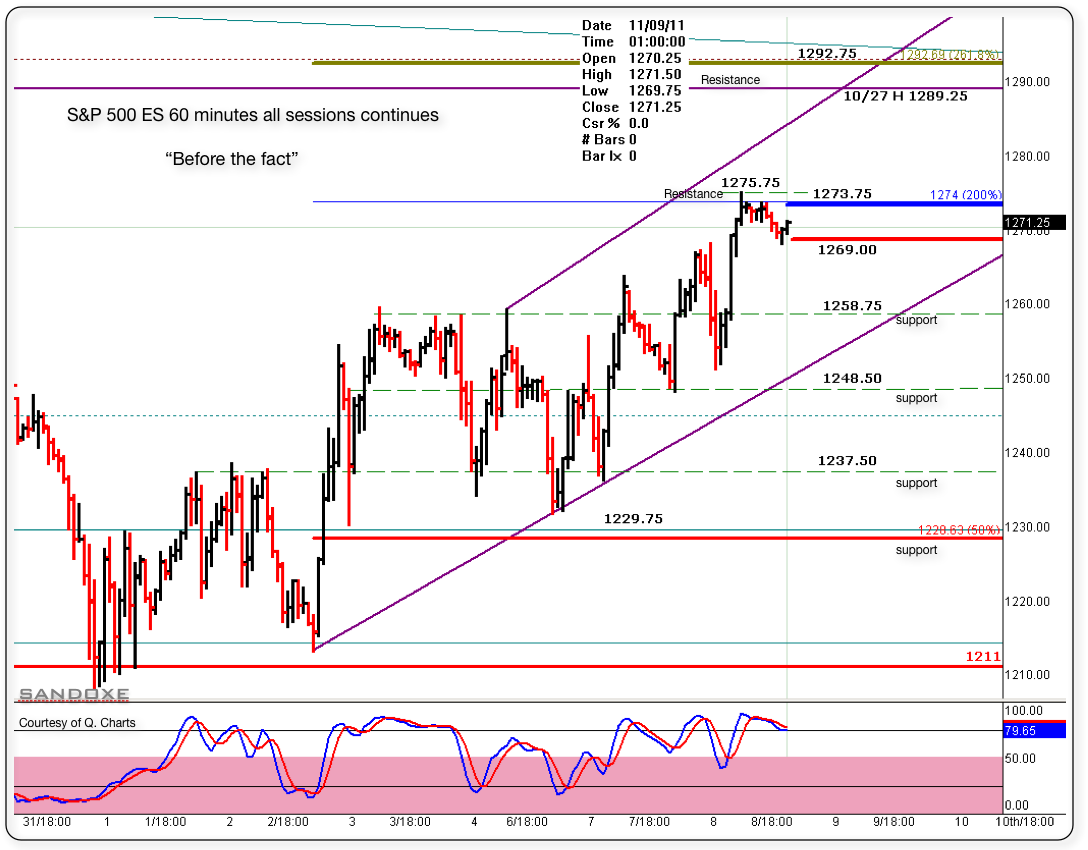
Below is a 60 minutes chart with today's session set-up. The blue (1273.75) and red line (1269.00) are my guide lines to focus on buying or selling. If the price is above 1273.75 I will focus on buying set-ups till it gets to some type of resistance. Conversely, if the price is below 1269.00, I will focus on short set-ups till the price gets to some type of support and so on.
P.s. I'm still dealing with MF Global about my money, so posting is a bit slow for me.
As always, the market has the last word and in due time will show us the way.
Right now, next hours, next days, next weeks, next months and next years to come, I see for you the same I see for my self: Having the very best of luck, fun, awesome, incredibly profitable trading experience!!
Click image for original size
Below is a 2 minutes ES day session of today's action. The chart is a follow up for the one posted yesterday with S/Rs levels. Basically the chart shows what the heck took place with them S/Rs.
In the chart, I'm showing the stochastic' behavior in up-trend conditions. (Did not did the down trend bc will be too confusing. Some other time I will.-)
Notice that the action is similar to the one shown in the short video posted yesterday, that is interesting bc the video's simulation is done with a 60m chart!
I hope all this stuff helps in some way.
Click image for original size

Below 1258.50 and 1250 62% levels not a positive
back in the range
58.50-62%
1249-50%
1239.50-38%
the field of play
1244 current R level
back in the range
58.50-62%
1249-50%
1239.50-38%
the field of play
1244 current R level
just in case, the new measured down target is 1193.50
besides 44
46.50, 49, and 50 above
current correction target if able is 51.50
46.50, 49, and 50 above
current correction target if able is 51.50
what I'm watching
BKX-S/R 40
XLF-S/R 13.50
DJI current S/R levels
11900
above 12025 and 11962.50
below 11837.50 and 11775
BKX-S/R 40
XLF-S/R 13.50
DJI current S/R levels
11900
above 12025 and 11962.50
below 11837.50 and 11775
I'm still short and looking at retest of 1237 and possibly 1228 as 2nd objective. I believe we are in a (iii) of 5 E.W. down. (as per 10 minutes chart all sessions)
ES now trading 1241.75 @ 13:17 E.T.
ES now trading 1241.75 @ 13:17 E.T.
Originally posted by sandoxe
Below is a 60 minutes chart with today's session set-up. The blue (1273.75) and red line (1269.00) are my guide lines to focus on buying or selling. If the price is above 1273.75 I will focus on buying set-ups till it gets to some type of resistance. Conversely, if the price is below 1269.00, I will focus on short set-ups till the price gets to some type of support and so on.
P.s. I'm still dealing with MF Global about my money, so posting is a bit slow for me.
As always, the market has the last word and in due time will show us the way.
Right now, next hours, next days, next weeks, next months and next years to come, I see for you the same I see for my self: Having the very best of luck, fun, awesome, incredibly profitable trading experience!!
Click image for original size
ES tested 1237.50 as support and failed, now moving to test 1229/1228 support cluster. - trailing stop at 1238.75. Failure to find support at 1228 will target 1214 and possibly 1200/1198.
ES now trading 1233.75 @ 13:59 E.T.
ES now trading 1233.75 @ 13:59 E.T.
1223.75 top of the box
target is 1222 or 1210
see what kind of bounce??
1226 a s/r level
32,34 above
target is 1222 or 1210
see what kind of bounce??
1226 a s/r level
32,34 above
targets from rth hod
75.50-37
49 area equal move down= 1210
68%-1222
it's a target
doesn't mean it will get there in one move or if it'll stop there if it makes it
75.50-37
49 area equal move down= 1210
68%-1222
it's a target
doesn't mean it will get there in one move or if it'll stop there if it makes it
the bullish risk is it's just a retrace to the top of the box
gap above
gap above
Understand your video is not the chosen medium in a forum and most won't see it in rth. So if you must refer to a position, post the entry near time of entry (few minutes). Your entry could have been posted in O/N with your other early am posts and there wouldn't have been an issue,imo. I don't need to be awake to see it if it's timed near price of entry. Addressing this is occupying your time and mine.
It's an effort for someone to post. I don't think this is adding value to our efforts.
Either you'll honor the etiquette or you won't. You'll do what you'll do. Others will do what they do. I'm going back to what I do.
All the best to all.
It's an effort for someone to post. I don't think this is adding value to our efforts.
Either you'll honor the etiquette or you won't. You'll do what you'll do. Others will do what they do. I'm going back to what I do.
All the best to all.
Originally posted by sandoxe
Thank you DavudS. It was a crazy day for me bc I was not expecting to start that trade when I was working with my charts trying to set-up for next day. I took the trade and placed the protecting stop and the market just keep moving down, I moved my protecting stop down and the market just did not looked back! I'm sure you had have one lucky trade like that. Its one in 100 that happens. It really was a gift to me. I need it that.
I do have to say that I never did mentioned the exact price of entry but in my video I did pointed out what I was going to do.
I will post a video with the trade and how it all unfolded. In the video I also have the posts made today here at the forum, so you and every body will see what I was talking about and where the ES was at the time of the post. I like videos bc I can show so much more in very little time, and I think people will learn something from them. I hope.
Thanks again DavidS.
Originally posted by DavidS
Apologies.
The second post mentioned your trailing stop loss.
Just to be accurate about the issue for your understanding.
I sincerely hope this allows you to see what I'm trying to convey.
I type slow and value your time and efforts, and mine.
Emini Day Trading /
Daily Notes /
Forecast /
Economic Events /
Search /
Terms and Conditions /
Disclaimer /
Books /
Online Books /
Site Map /
Contact /
Privacy Policy /
Links /
About /
Day Trading Forum /
Investment Calculators /
Pivot Point Calculator /
Market Profile Generator /
Fibonacci Calculator /
Mailing List /
Advertise Here /
Articles /
Financial Terms /
Brokers /
Software /
Holidays /
Stock Split Calendar /
Mortgage Calculator /
Donate
Copyright © 2004-2023, MyPivots. All rights reserved.
Copyright © 2004-2023, MyPivots. All rights reserved.