ES SRs and Fibs 11/15/11
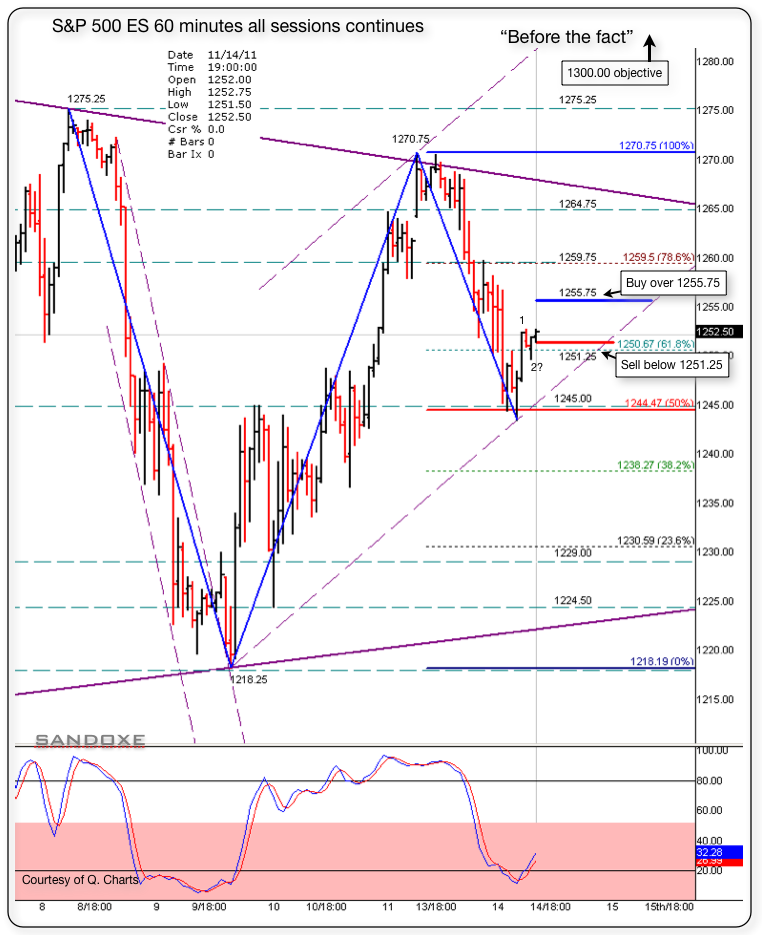
Below is a 60 minutes charts with the S/Rs for night and day traders. Notice that the ES tested the 50% at 1244.50 and bounced back up. Above 1255.75 I will be buying and focusing on uptrend.
if, below 1251.25, I will be selling and focusing on down trend, with support at 1245.00 for a reversal.
The market has the last word and in due time will show us the real deal in dollars and cents.-.
Right now, next hours, next days, next weeks, next months and next years to come, I see for you the same I see for my self: Having the very best of luck, fun, awesome, incredibly profitable trading experience!!
Click image for original size
I am looking for 1253.50 up to 1257.25 to be a sell zone ... close above 1257.25 could be bullish ...
I'm short at 1251.00, had stop at 1253.00 and just moved it down to 1252.25. I don't like the way the 10m. stochastic looks. It's almost in oversold. The price could spring back up soon. If so I will be lending the market 1.25. Will see.
You had a good sell zone. :)
ES now trading 1250.75 @ 21:53
You had a good sell zone. :)
ES now trading 1250.75 @ 21:53
Originally posted by redsixspeed
I am looking for 1253.50 up to 1257.25 to be a sell zone ... close above 1257.25 could be bullish ...
Still short -- If stop out, then will look to reverse with stop at 1249.50 or so, then when the price gets to 1253.50 I will move the stop up to B.E. In other words, I will be using the sell line to buy above it. Only bc the 10 m. stoch is in oversold.
Will see, that's plan B for now. --
ES trading 1250.50 @ 23:03
Will see, that's plan B for now. --
ES trading 1250.50 @ 23:03
Originally posted by redsixspeed
I am looking for 1253.50 up to 1257.25 to be a sell zone ... close above 1257.25 could be bullish ...
=====================================================================
"They" sold that area hard .. 1232.50 on the radar
Yes. possibly 1219 test by 10:30. Tuff start got zig-zag twice I'm trailing it 5 points back.
78% ret. at 1229 and support. Needs to move fast down true that. Keeping my eye on it. We are close to your 32.50
Now trading 1234.50 06:46
Now trading 1234.50 06:46
there are two calculated areas here 1234.75 & 1232.50 .. "they" hit it in the mid point of the two first time down ...
I will not let it go too much over above the last 10m bar 1240.00 i"m out. Just hit it.
Day traders starting to come in. Will wait for an other set-up.
Price moved over the resistance trend line. It has to go back in, in order for me to g short again. Or a test of 1242.25 resistance and failure. Will see.
Now trading 1240.75 07:47
Now trading 1240.75 07:47
I ran out of votes to vote you up :(
Originally posted by sandoxe
1242.25. beautiful call. post on 11/16/11 will ya! lol
Originally posted by redsixspeed
Originally posted by redsixspeed
below 1245.25 could mean lower .. holding so far
=====================================================================
I tried to get this up sooner .. had a time finding it .. anyway that 1245.25 is a key area for me .. new #s I have are at 44.00/42.25 but
45.25 is still key ..
Emini Day Trading /
Daily Notes /
Forecast /
Economic Events /
Search /
Terms and Conditions /
Disclaimer /
Books /
Online Books /
Site Map /
Contact /
Privacy Policy /
Links /
About /
Day Trading Forum /
Investment Calculators /
Pivot Point Calculator /
Market Profile Generator /
Fibonacci Calculator /
Mailing List /
Advertise Here /
Articles /
Financial Terms /
Brokers /
Software /
Holidays /
Stock Split Calendar /
Mortgage Calculator /
Donate
Copyright © 2004-2023, MyPivots. All rights reserved.
Copyright © 2004-2023, MyPivots. All rights reserved.