The Fib Grid
Here is my master chart which has evolved out of my "Ratchet" concept I have mentioned on the day trading threads. With these levels you will never again need to measure moves, run fibs or dare I say possibly even draw market profile numbers on your charts. Ok, perhaps that is all a bit extreme but these levels will never change and work great on the stock index markets.
I've notice over a great many years that the market respects certain levels of prices. The basic ones are the numbers ending in "00", "50" and "75". What I have done is add in some key numbers that Lewis Borsellino used. These where the percentage retracement numbers of 12.50, 25 ,33, 50, 66, 75 and 88 percent numbers but in one interview ( I'll be damned if I can find it) he implied additional uses of the numbers. Sorry Jim Kane and Roofer but Lewis was the first one to make the 88% numbers available to me. Perhaps he stole it from you back in 1996!
For me the additional twist comes when you add in fib numbers....not the actually levels....this requires no measuring or deciding where to snap fib lines. We are only concerned with the fib numbers themselves. The missing ingredient comes with use the 6.25 point ratchets to fill in the gaps in the missing areas. We are basically having a key number at every 6.25 points with a few exceptions and greater emphasis in the confluence zones.
As usual the entries will come down to an understanding of price action and/or order flow. Closes on the 15 minute time frame after 10 a.m. Eastern time shows promise but I don't "do" system trades. Lets put the numbers down here first before we look at a few charts.
00 - the basis of it all and key rat
06.25 Ratchet number
12.50 - 1/8th
18.75 -rat
23.5 - Fib number
25 - key Rat 1/4
33 - 1/3
38 -Fib
43.75 - rat
50 fib - not officially - 1/2 key level not labelled on my chart
56.25 -Rat
62- fib
66- 2/3
70 -Fib
75-key rat 3/4
78 -fib
88-fib
93.75-rat
100
There they are. All the numbers you will ever need for the ES. It doesn't matter if we are at 1200 or 100 in the S&P we just use the last few digits....so we could be using 138 or 1238 for example of the 38 number...no snapping lines required.
Are these perfect? No,but what method or level actually is ? Numbers will hit over time..all numbers and all levels...posting numbers is the easy part but it does help others in being able to spot areas to potentially take trades from. These levels are best used in conjunction with your current methods. I use them with the market profile and the low volume numbers.
Here is a chart from the last week. You will notice how the clusters of numbers work very well at pointing out tops and bottoms. Those clusters are the 62 - 66 zone, the 23.50 - 25 zone and the 75 - 78 zone.
Click image for original size
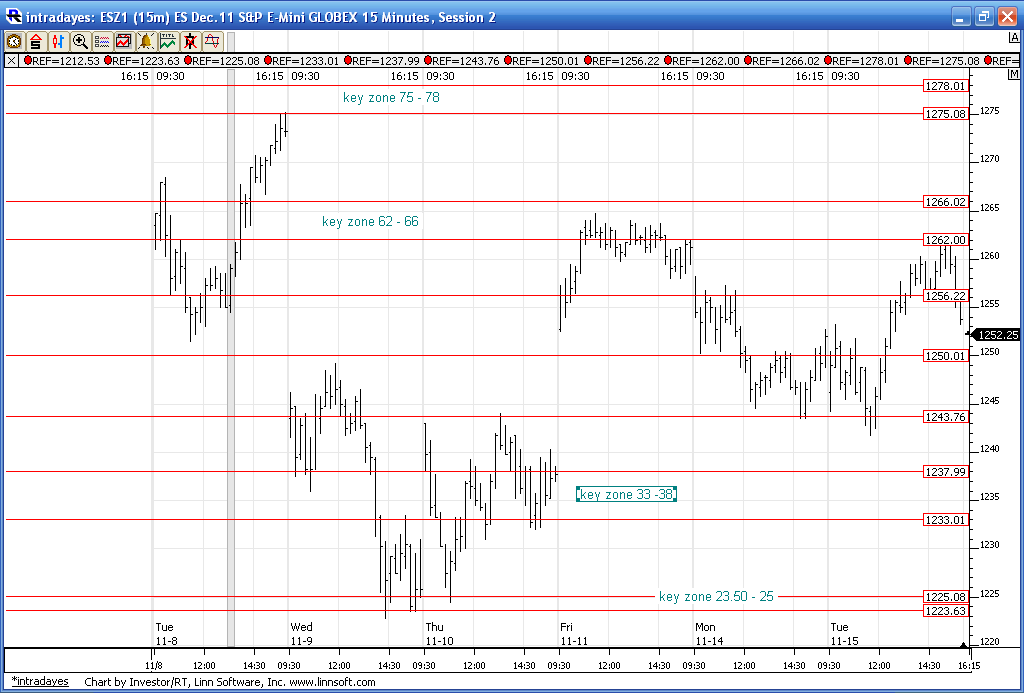
use the grid to confirm the area ^^^
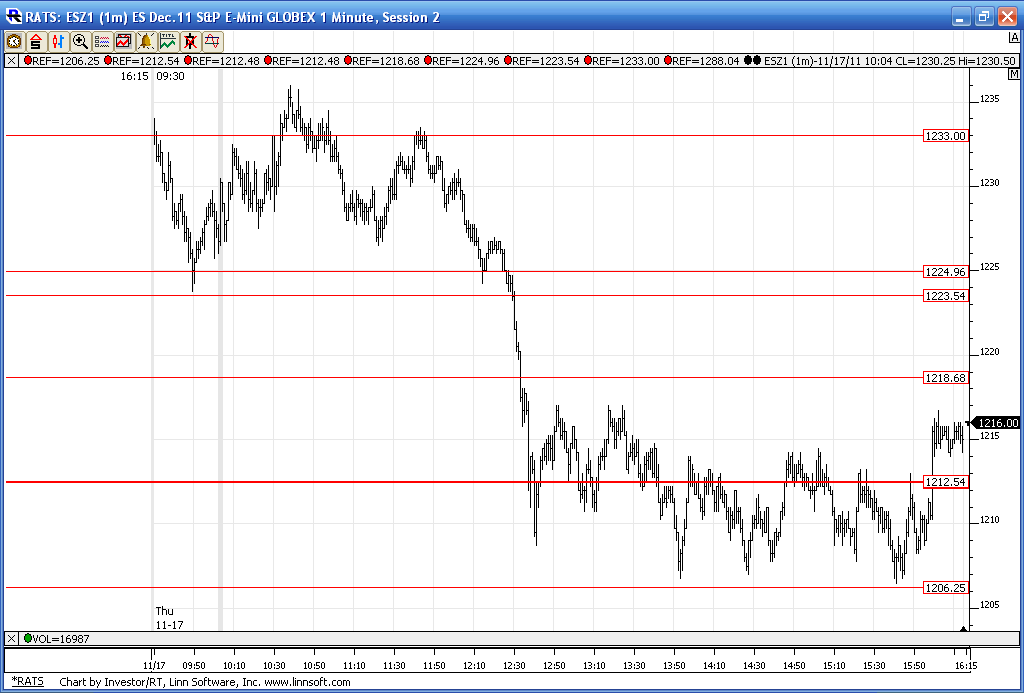
Here is how the grid looked for Thursdays Trade on the one minute time frame. Interesting that we have a low volume area that was created right near the 18.75 Rat. We had very large vertical volume (see this thread for some basic ideas on that http://www.mypivots.com/board/topic/1295/1/pitbull-setup-part-ii ) at the 16.75 area today so that 2 point range will be critical and I think it will get tested overnight.
Nice containment considering these are static numbers that don't change. I plan on trying to post charts that show examples of all the levels being used when they eventually trade. Hopefully the market will trade at the 00 and the 94 rat soon.
Nice containment considering these are static numbers that don't change. I plan on trying to post charts that show examples of all the levels being used when they eventually trade. Hopefully the market will trade at the 00 and the 94 rat soon.
Click image for original size
These comments go well here and are from another thread posted by Charter Joe. I encourage those interested in static numbers to do a search on Prime Numbers from Charter Joe.
Charter Joe said:
"The other thread was locked maybe guy will forgive me? Just wanted to say that was a great topic Bruce. They work well with sq nine 1208, 1225 and 1243 and the infamous 1261.
Most want trade these numbers, because there too simple. I also have heard lewis say he uses these numbers. Gann wrote about them in his "How to profit in commodities" the 1/8ths of $1 or $100 on page 31 or 37. "
here are the Rats for the last three days on a 10 minute chart so I could fit it:
Click image for original size
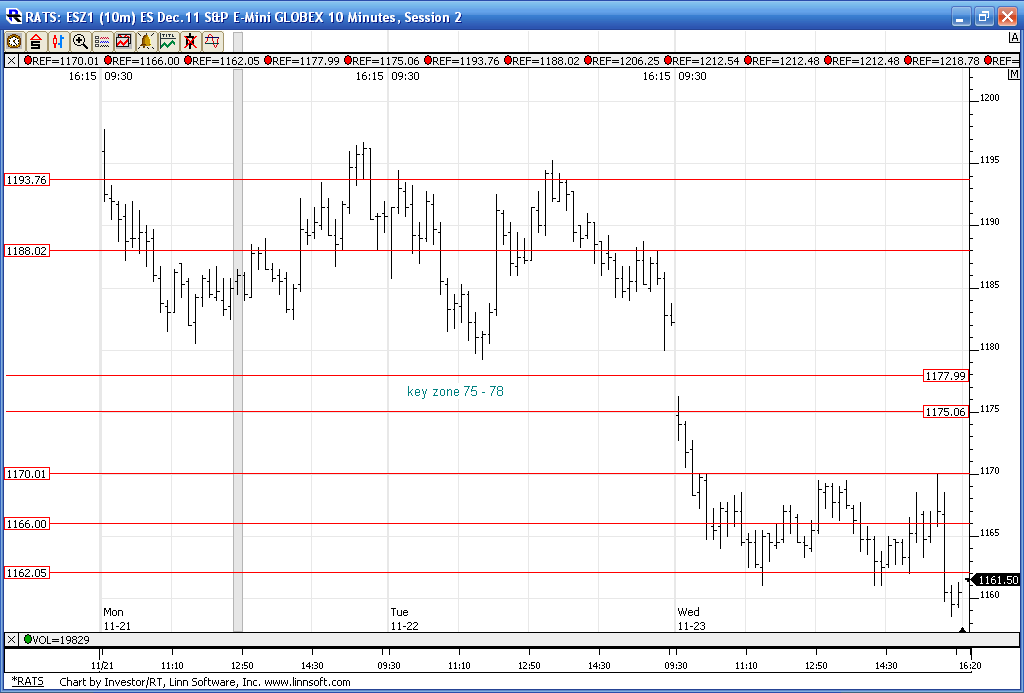
not mentioned in my above post is that 62 - 66 is a key zone because of the 62 fib and the 66 (2/3 rds) level...when two areas come close we need to treat it as a zone...like the 75 - 78..
the 61 blows me away so dos the 75 78
Originally posted by BruceM
not mentioned in my above post is that 62 - 66 is a key zone because of the 62 fib and the 66 (2/3 rds) level...when two areas come close we need to treat it as a zone...like the 75 - 78..
... so Bruce, can we call you RATMAN from now on?!? Hope the bird went down nicely today. Nic's yapping on the phone with her mom in VT right now. Btw, great thread ... great format that you started out with laying down the numbers in an easy way to understand ... RATMAN!
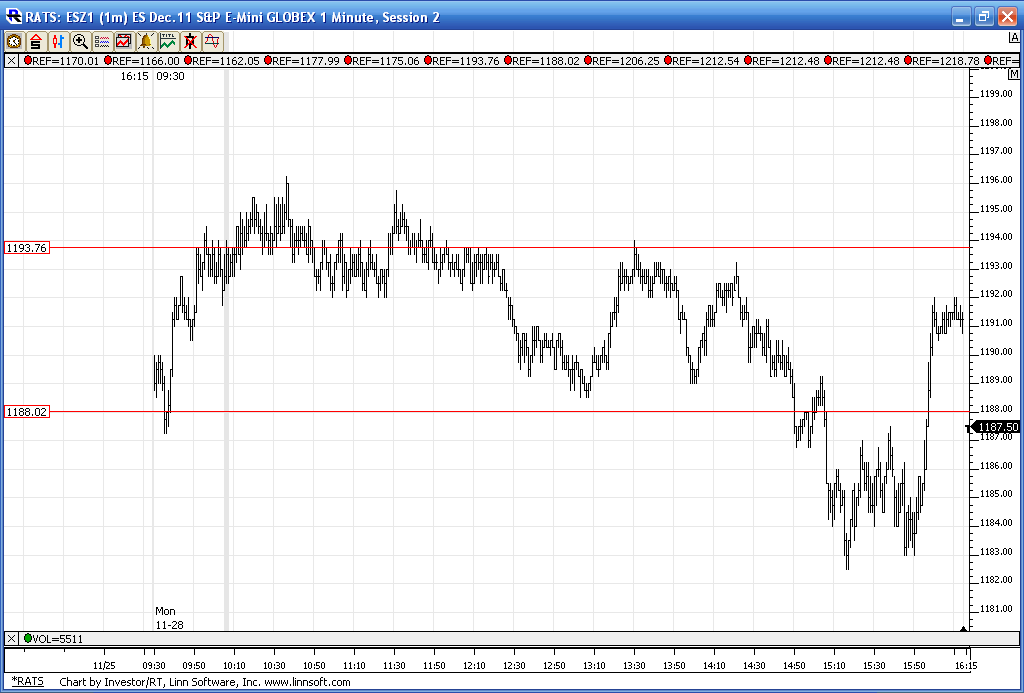
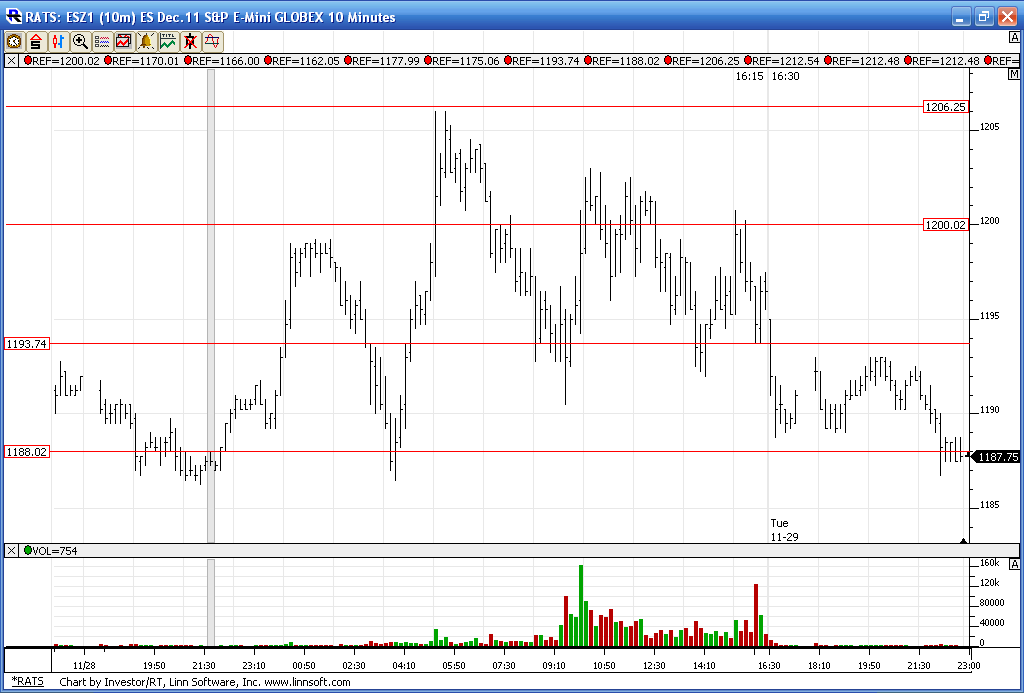
here is how they looked today..only two to work with...which means tomorrow we should see 3 rats print....just a way of saying low volatility comes before higher volatility...hoping we can see the 1200 Rat soon...
Click image for original size
I was hoping the day session would provide us with the 1200 and the 1206.25 Rat but that didn't happen today. As a substitute I am showing the overnight from Monday night/Tuesday, Tuesdays day session ( see the volume histogram in the lower pane if you can't read the time display) and then Tuesday after hours up until about 10:45 E.S.T. Gonna wrap up the rat postings as I think it is a fairly simple idea.
For those who are impatient or get frustrated with the lack of RAT opportunities you might try adding in one modification to the 10 point area between the 75 - 78 zone and the 88 rat. Since that distance is 10 points we might want to include 83 ( splitting the distance)into our master set of numbers to cover all the key areas. As usual these will all work best when there is confluence with the methods you use and paying attention to the key round numbers and the key zones.
Click image for original size
For those who are impatient or get frustrated with the lack of RAT opportunities you might try adding in one modification to the 10 point area between the 75 - 78 zone and the 88 rat. Since that distance is 10 points we might want to include 83 ( splitting the distance)into our master set of numbers to cover all the key areas. As usual these will all work best when there is confluence with the methods you use and paying attention to the key round numbers and the key zones.
bruce - great work. but i see no connection to my work and am puzzled that you chose to take a swipe at me...many of the numbers i use were first shown to by tom demark in 83 when he ran futures forcast... does that take precedent over you seeing them in borsolino's work in 98?
if you have issues with jim kane .. then have issues with jim kane.
i will repeat what i have said endless time...before i knew jim, i did not know theIMPORTANCE of the .886... jim's pound the table insistence that the .886 was THE MOST IMPORTANT FIB NUMBER drove me nuts.... I SET OUT TO PROVE HIM WRONG.... instead i found that the big traders and computers were trading an algo based on the .886 to signal their intent.886gap5@geo... i take no credit for creating anything except the written work to report to my fellow traders the algo... in posting the slate pile, i asked that no one in the private kane forum say anything... let it stand alone...i believe that previous to my written work, there is no work showing the .886gap5@geo in the literature of technical analysis... if you can show it to me,i will be contrite...
i think we succeed as traders because we focus on a method, not because A method is the best. all day long this past friday the computers and big traders relentlessly carpet bombed the market using the .886gap5@geo... in my records it will go down as one of the great days...but if you were totally focused on the snp. what the computers were doing was invisible. and is as it should be FOCUS.your work is awesome... but i am equally struck with awe in watching jim call the turns day after day in his forum. at times jim and i are deeply at odds based on the tools but we don't make it personal.i see little point in criticizing another way to advance one's own.
Sorry this is a bit off topic but was wondering if anyone is using X-Trader DOM? If so do you know how to display 10 levels of depth vs the standard 5? Thanks
Emini Day Trading /
Daily Notes /
Forecast /
Economic Events /
Search /
Terms and Conditions /
Disclaimer /
Books /
Online Books /
Site Map /
Contact /
Privacy Policy /
Links /
About /
Day Trading Forum /
Investment Calculators /
Pivot Point Calculator /
Market Profile Generator /
Fibonacci Calculator /
Mailing List /
Advertise Here /
Articles /
Financial Terms /
Brokers /
Software /
Holidays /
Stock Split Calendar /
Mortgage Calculator /
Donate
Copyright © 2004-2023, MyPivots. All rights reserved.
Copyright © 2004-2023, MyPivots. All rights reserved.