ES Wednesday 11-23-11
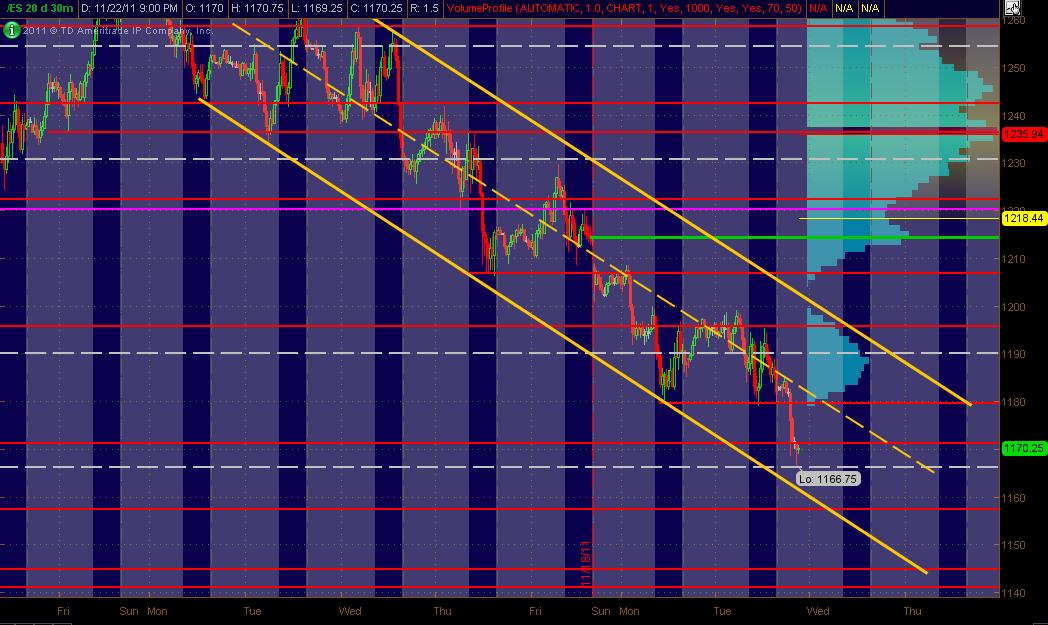
Here's what I've got for my ES MAP of PASR ZONES using a 30min chart of 20 days of data coming into Wednesday's trading. The Red lines are potential significant levels with Magenta lines as semi-significant. The White dashed lines are the Weekly Pivots and the Green line is a Gap to be closed. The Light Blue Volume Profile of the past "rolling" 20 days is displayed on the right vertical axis. The Gray background shows non-RTH price activity.
As of this post, the mkt has traded down to 1166.75 ... there's a Wkly Pvt there and also I had 3 (I think) Fibs clustered there. Anyway ... also drew in a Trend Channel in Yellow for some "perspective." Hope this is helpful to some!
Thangs are gettin' kind of whacky ... and we're in a holiday week, so beware!
MM
And Happy Thanksgiving to all who'll be celebrating it ... as I will, way too much good East Texas Turkey Day food!
As of this post, the mkt has traded down to 1166.75 ... there's a Wkly Pvt there and also I had 3 (I think) Fibs clustered there. Anyway ... also drew in a Trend Channel in Yellow for some "perspective." Hope this is helpful to some!
Click image for original size
Thangs are gettin' kind of whacky ... and we're in a holiday week, so beware!
MM
And Happy Thanksgiving to all who'll be celebrating it ... as I will, way too much good East Texas Turkey Day food!
Very Nice MM...
Here is how it looks in my world. This is the day and overnight sessions from 10-9 and the 6 sessions following. We are now in the overnight session ( not shown here)at a key peak time price at 1168. We have the boundaries at 1162 and 1172 (low volume areas)with the 68 in the middle. It will interesting to see what happens for the rest of the Overnight.
Peak volume from the current O/N session is up at 77 - 78.
Click image for original size

When the news of the bad German note auction got out the ES dropped from 1182.5-1168.75. If we do not take out 1182.5 I would watch for a tradable bounce in the area of the initial Kools Tools down projection of 1160.25. This move gives a full projection of 1146.5 which is also valid until 1182.5 is hit again.
just thinking of something there is action overnight up to the 78.25 are and down to 67.25 kind a formed a balance are short up there in that LV are??
looks like the plan will be to sell on a first test into 76 - 78 from below, try to buy the 72 if we open above ( higher risk because of overnight peak volume) and try to buy the 68 area. A nice bell curve from the O/N session to work with...chart later...
spike on 1 min chart up here
didnt get it but there will be more on the way down to 72.00
My Micky mouse footprints still showing selling
Originally posted by prestwickdrive
When the news of the bad German note auction got out the ES dropped from 1182.5-1168.75. If we do not take out 1182.5 I would watch for a tradable bounce in the area of the initial Kools Tools down projection of 1160.25. This move gives a full projection of 1146.5 which is also valid until 1182.5 is hit again.
A more immediate down projection off the last cycle high of 1176.5 to that cycle low of 1172.75 gave an initial KT projection of 1170.5 and a full of 1166.75
air pocket above so looking for buys below 68 now !!
bruce, wasn't 68 the peak volume from the distribution youshowed for 10/9 ? if so why the buy right there at the peak vol? may be i missed sthg
thanks
thanks
Originally posted by BruceM
air pocket above so looking for buys below 68 now !!
finally we get some long runners to move a bit ...this has been one of those days were runners go nowhere...like the 5 minute air fill earlier.....hits initial target and then stopped going up....
Emini Day Trading /
Daily Notes /
Forecast /
Economic Events /
Search /
Terms and Conditions /
Disclaimer /
Books /
Online Books /
Site Map /
Contact /
Privacy Policy /
Links /
About /
Day Trading Forum /
Investment Calculators /
Pivot Point Calculator /
Market Profile Generator /
Fibonacci Calculator /
Mailing List /
Advertise Here /
Articles /
Financial Terms /
Brokers /
Software /
Holidays /
Stock Split Calendar /
Mortgage Calculator /
Donate
Copyright © 2004-2023, MyPivots. All rights reserved.
Copyright © 2004-2023, MyPivots. All rights reserved.