RO
roofer
Rep: 3,689
Posts: 3,574
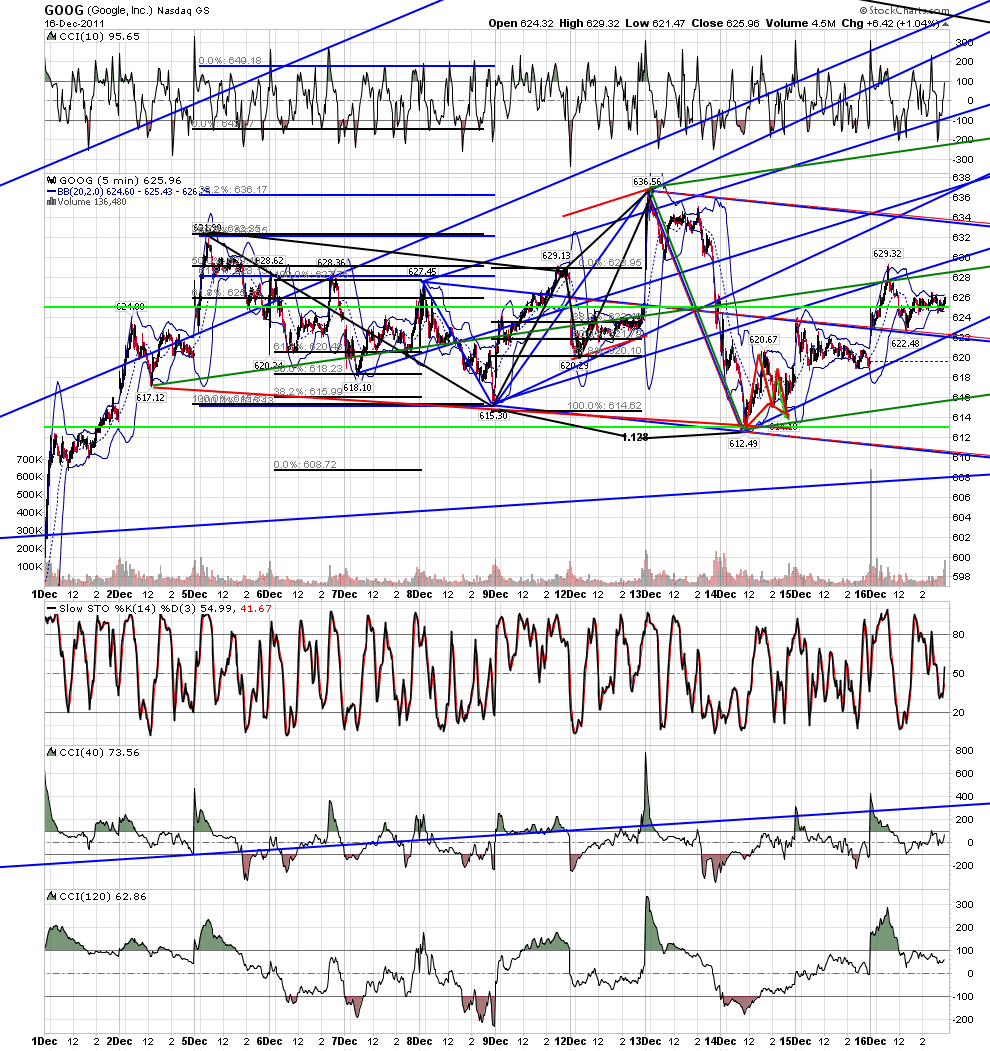
december is the numbers trading- game playing month....
Click image for original size
RO
roofer
Rep: 3,689
Posts: 3,574
if the long term of gold and silver is so bullish, why are the long term charts of the gold stocks so bearish?fast melt down like end of 08?,,, possibilty of which the fcx chart has been pointing to since jan...
RA
rat89
Rep: 0
Posts: 7,015
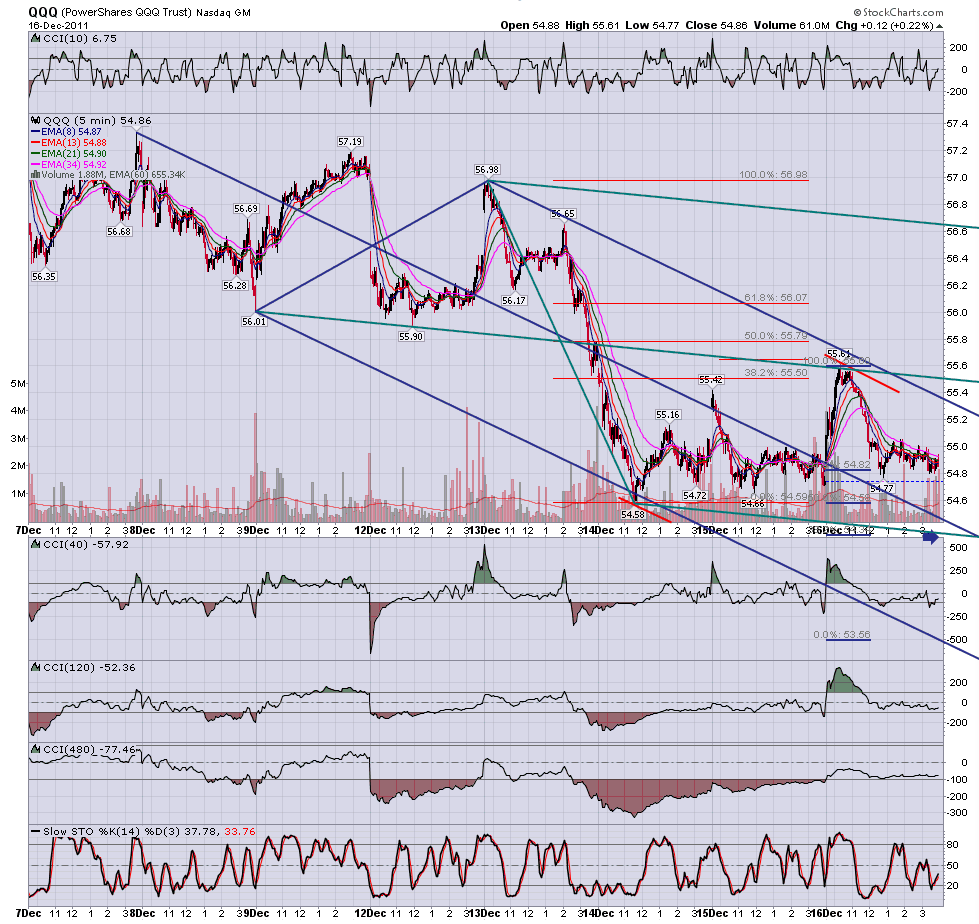
am I seeing this right?
abcd .447 into a 1.27?
abcd .447 into a 1.27?
Click image for original size
JI
jimkane
Rep: 3,058
Posts: 33,089
And 1210.75 drops it down into an ABCD. Is this a bullish 'W2' ABCD? Up it goes? Or 'W3', and down? Time to decide. What's the bigger picture say? Ah-ha, Jim says. Do the work. Don't ask me for 'the answer'. I have shown how I do the work. Now, you do the work.
'Give a man a fish, he eats for a day. Teach him to fish, and he eats for a lifetime.'
'Give a man a fish, he eats for a day. Teach him to fish, and he eats for a lifetime.'
RO
roofer
Rep: 3,689
Posts: 3,574
terms of markets, we are entering a heavily populated time band as we approach the holiday season. From December 18 through December 28 there will be six major geocosmic signatures that have a strong correlation to market reversals. The two strongest take place December 18 and 20 (Venus in waxing square to Saturn and waning square to Jupiter, forming a strong T-square configuration). On Christmas, December 25, Jupiter will turn stationary direct at 0 degrees Taurus, which is the center of the 0-7 degrees of Taurus segment where studies reported in our past three Forecast books have shown the stock market tends to make a long-term cycle high – and then commence a 2-4 year bear market.
JI
jimkane
Rep: 3,058
Posts: 33,089
Down 8.75 off that, right to an area. See why I teased the market and called it a hot shot, as it rose very strongly there? I didn't care how strong it bluffed at me, I knew what it was facing. I knew what my 'context' was, and what my layout looked like. So, I was willing to post a comment like that in advance. No, it won't always play out, but I look at this from a probability standpoint. What is the most likely scenario, in my mind? And that's, indeed, exactly what it did.
Originally posted by jimkane
Okay, let's see what you do around 1210.25-11.25, hot shot.
JI
jimkane
Rep: 3,058
Posts: 33,089
Oh, please, oh, please, oh, please let it be so...
Originally posted by roofer
terms of markets, we are entering a heavily populated time band as we approach the holiday season. From December 18 through December 28 there will be six major geocosmic signatures that have a strong correlation to market reversals. The two strongest take place December 18 and 20 (Venus in waxing square to Saturn and waning square to Jupiter, forming a strong T-square configuration). On Christmas, December 25, Jupiter will turn stationary direct at 0 degrees Taurus, which is the center of the 0-7 degrees of Taurus segment where studies reported in our past three Forecast books have shown the stock market tends to make a long-term cycle high – and then commence a 2-4 year bear market.
JI
jimkane
Rep: 3,058
Posts: 33,089
And here's the chart. Sorry it doesn't show the work. You do the work. I point out where I think people should do work, for the best educational value. This chart is just to show what I said and what happened. Maybe to convince people to do the work when I point out an area... When I point things out I do it because I think it is worth the work, to study what is there.
Chart created on QCharts, courtesy eSignal
Click image for original size
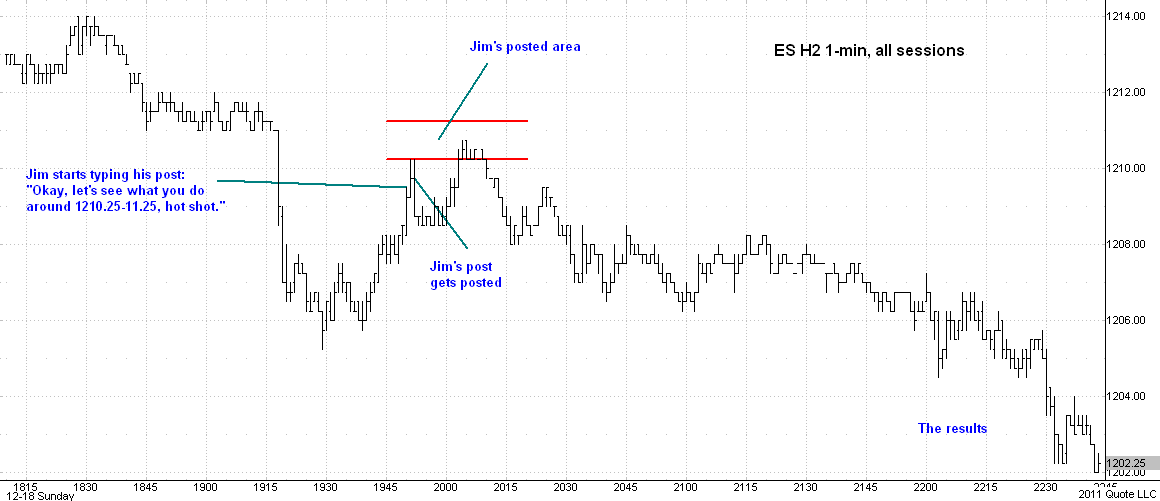
Chart created on QCharts, courtesy eSignal