JI
jimkane
Rep: 3,058
Posts: 33,089
Here's a chart to ponder. I have another insane line right there, but I don't want to post it. I used the SPY for this example, since it is a tradeable instrument. The differences are minor.
Chart created on QCharts, courtesy eSignal.
Click image for original size
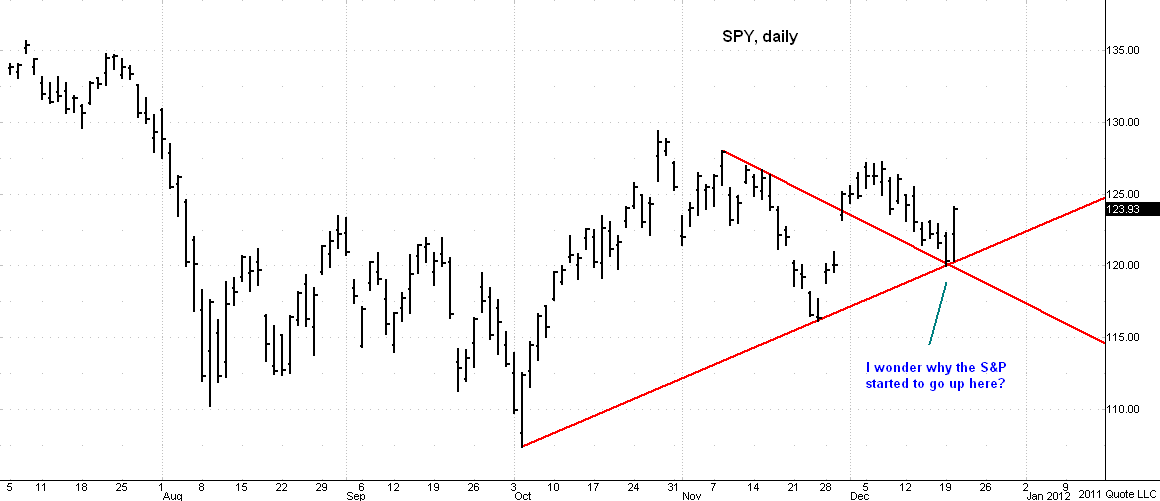
Chart created on QCharts, courtesy eSignal.
JI
jimkane
Rep: 3,058
Posts: 33,089
Another nice pop up in the futures. Sure acts like it wants to rise strongly until year end. If so, we very well may see Carl Futia's target. It just seemed like the Euro sentiment, via the commitment of trader's report and other measures, was so bearish, it is year end, that just set this up for some government manipulation news, and out it comes, as if on cue. Because, in my opinion, it was on cue.
I wish it would just go to the lower area roofer showed. More than anything I wish it would. But, I'm not looking short side at all until I see a short side setup after it starts down. I'm not looking for extreme trades in here at all. Not the way this is acting. This is just my two cents. When it gets like this, and has all these factors in play, I need to see it roll over and then give me a little something to work with. This may have me missing the extreme entry, but so what. Right now I'm just 'long and never wrong'.
I wish it would just go to the lower area roofer showed. More than anything I wish it would. But, I'm not looking short side at all until I see a short side setup after it starts down. I'm not looking for extreme trades in here at all. Not the way this is acting. This is just my two cents. When it gets like this, and has all these factors in play, I need to see it roll over and then give me a little something to work with. This may have me missing the extreme entry, but so what. Right now I'm just 'long and never wrong'.
JI
jimkane
Rep: 3,058
Posts: 33,089
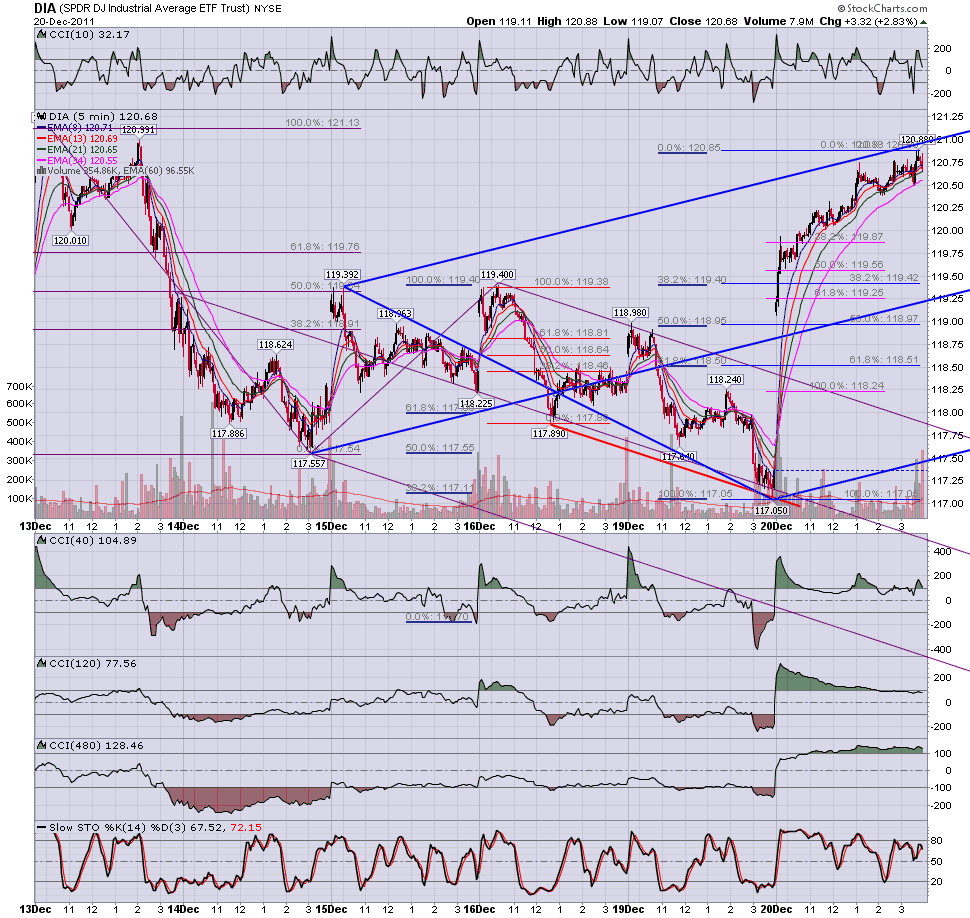
Notice that there is a DB ABCD here, but it seems to have no respect yet for it at all. The upper area for that is around 44, where some other things come in. I'll surely see what it does in here. After that, my next key area is around 52-58. That's wide, since it is coming from the higher timeframe, and that encompasses pretty much the entire area. If it can get past that, especially without a good-sized checkback, that would not only be impressive, it would be a sure sign, to me, of massive manipulation. Like that's not obvious anyway.
So, I'm watching the DB ABCD in here, in case, and then the major area above that. That should hopefully give me some idea what this thing is thinking, and give me something to work with. We'll see. Same old game, different day...
So, I'm watching the DB ABCD in here, in case, and then the major area above that. That should hopefully give me some idea what this thing is thinking, and give me something to work with. We'll see. Same old game, different day...
SI
sirios
Rep: 0
Posts: 157
It's funny. Look at the daily chart of SPX and watch what was started on 26th december 2007. Do they really want to start this again the same day of year ?
RO
roofer
Rep: 3,689
Posts: 3,574
answer for SIRIOS
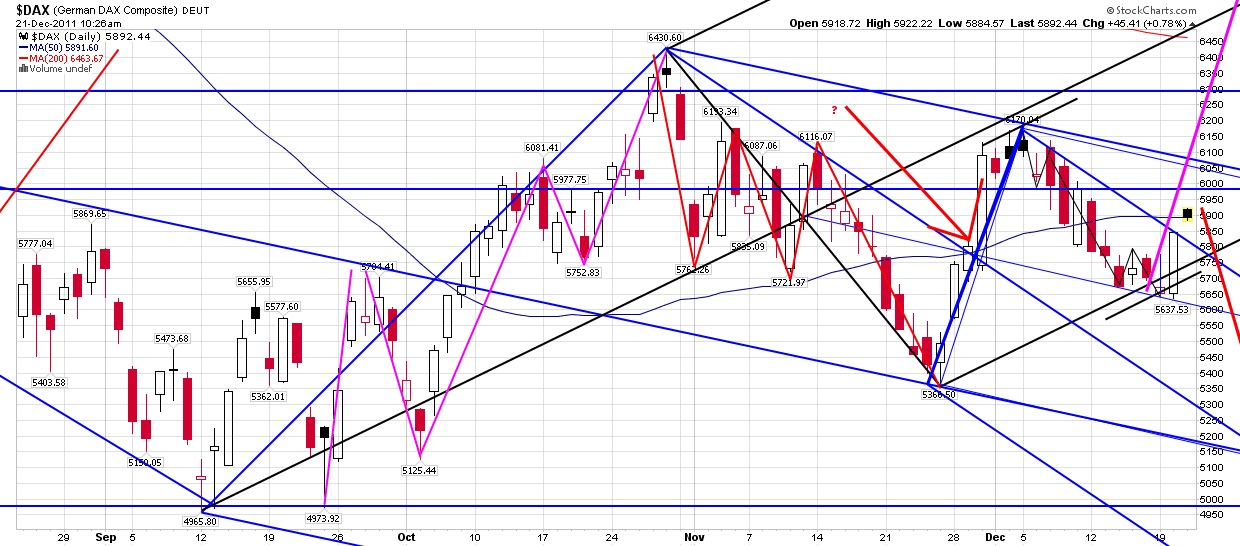
best illustrated with ftse....elliot perspective... if highlighted line is X wave separating two abc's., then price will turn down again,,, but if it is a wave 1, then price is about to go to moon in wave 3....
best illustrated with ftse....elliot perspective... if highlighted line is X wave separating two abc's., then price will turn down again,,, but if it is a wave 1, then price is about to go to moon in wave 3....
Click image for original size
SI
sirios
Rep: 0
Posts: 157
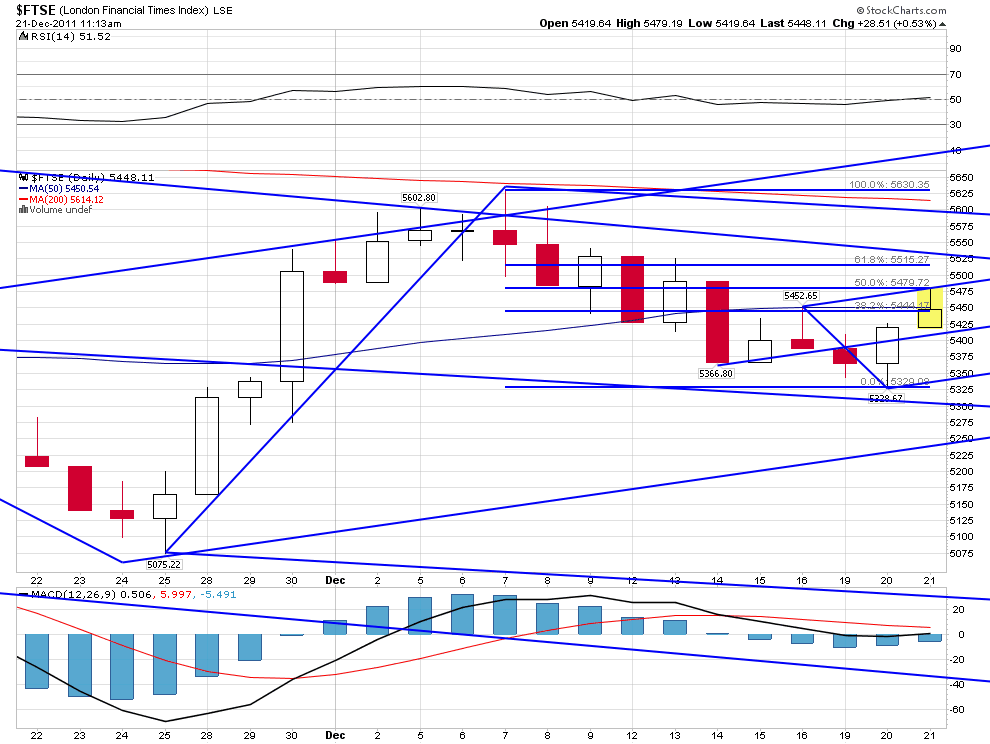
Thanks roofer. I also still think that both scenarios are possible, but many signs show that this can be a trap for "suckers". They go up to strong and they didn't give us any possibility to join to this trend. I think it is quite meaningful.
And Germany don't want to print Euro....
And Germany don't want to print Euro....
TO
tomo
Rep: 110
Posts: 238
I like to watch Block Trades. Yesterday on monster rally they sold more than 5 billion SPY in block trades. Normally you will see they sell into rallies and buy into drops. But 5 billion is huge and not normal. 27th October was the highest number (10 billion for sale) but they started selling already 21st Oct. And since 21st Oct block trades never came net positive for SPY. Just a food for thought. :)
Regards
Regards