ES Tuesday 17/Jan/2012
Here's what I've got for my ES MAP of PASR ZONES using a 30min chart of 20 days of data coming into Tuesday's trading. The Red lines are potential significant levels with Magenta lines as semi-significant. The White dashed lines are the Weekly Pivots (kind of a background thing to have on the chart). The Light Blue Volume Profile of the past "rolling" 20 days is displayed on the right vertical axis. Btw, price lines that are CLOSE together (within a couple of points), should be taken as an overall ZONE. The Gray background shows non-RTH price activity. Hope, as always, that this is helpful to some as a "MAP."
(Drew these in on Saturday) ... as of Today's (Monday) price, it moved up into the 1292 area of a PASR level ... will see what overnight holds in store.
(Drew these in on Saturday) ... as of Today's (Monday) price, it moved up into the 1292 area of a PASR level ... will see what overnight holds in store.
Click image for original size
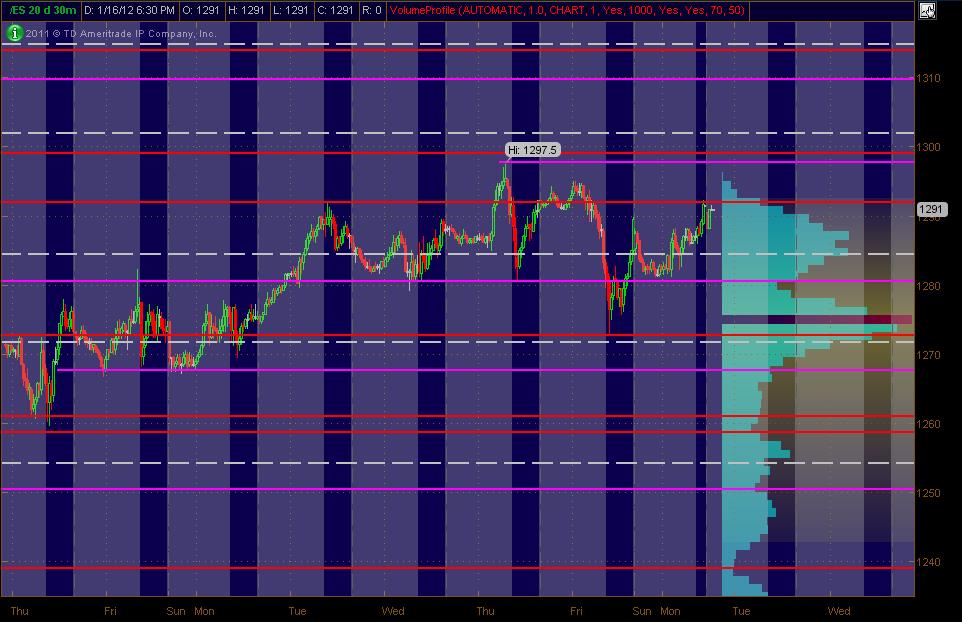
1308-10 Minor PASR / Daily R2 Pvt / Wkly DeMark R1 Pvt / 618 Fib Extension
1299-1302 PASR / RTH Daily R2 Pvt / Wkly R1 Pvt
1284-85 Daily Mid Pvt / Wkly Pvt / VolProf LowVol Area
1278-80 Minor PASR / RTH Daily S1 Pvt / Demark wkly S1 Pvt (and VolProf LVN past 20 days ... and VolProf HVN past 2 days? fwiw)
1299-1302 PASR / RTH Daily R2 Pvt / Wkly R1 Pvt
1284-85 Daily Mid Pvt / Wkly Pvt / VolProf LowVol Area
1278-80 Minor PASR / RTH Daily S1 Pvt / Demark wkly S1 Pvt (and VolProf LVN past 20 days ... and VolProf HVN past 2 days? fwiw)
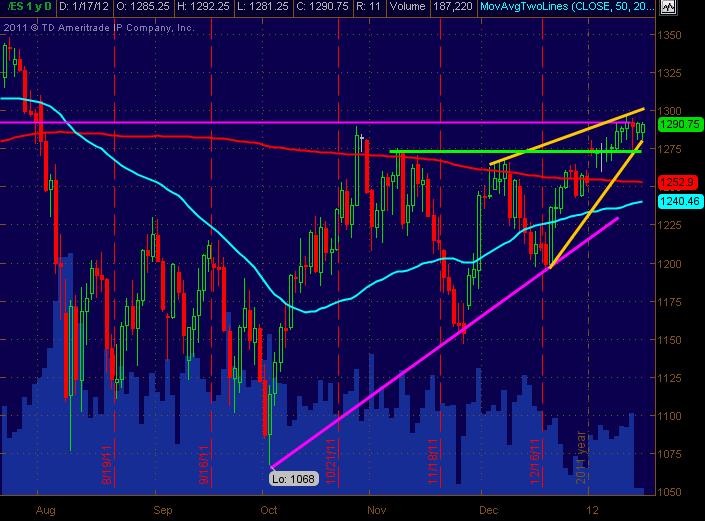
And the bigger picture of the daily ES (all trading hours). Magenta lines showing the ascending triangle that everyone and their dog's uncle sees ... with a smaller ascending wedge drawn in with Yellow lines. The 50 and 200 SMA's are included with a Green line I've drawn in as what may be a bigger pic inflection point of price fwiw. Just wanted to add the bigger pic to the 30min chart above to keep from being too myopic.
Click image for original size
This fellow has some good "reads" on the overall market as a trader/investor of stocks. Have a look at his post of 1-12-12
http://stockbee.blogspot.com/
MM
ps. Don't even know the feller, but regularly check his posts as a non-member ... has some good and insightful analysis in my opinion.
http://stockbee.blogspot.com/
MM
ps. Don't even know the feller, but regularly check his posts as a non-member ... has some good and insightful analysis in my opinion.
The biggest thing I'm thinking about is that it is options expiration week so the main RATS will come into play as option sellers try to keep price away from them. For me those keys are the 1325, 1300 and the 1275 especially as we enter midweek trade.
Key numbers which match up well with MM's numbers are:
1307 - 1311
1300 - 1302
1296-1297
1291- 1292.50
1289
1283 - 1284***
1280
1274.50 - 1276 *** critical support I think
lets see what the pitbull brings us today.
Key numbers which match up well with MM's numbers are:
1307 - 1311
1300 - 1302
1296-1297
1291- 1292.50
1289
1283 - 1284***
1280
1274.50 - 1276 *** critical support I think
lets see what the pitbull brings us today.
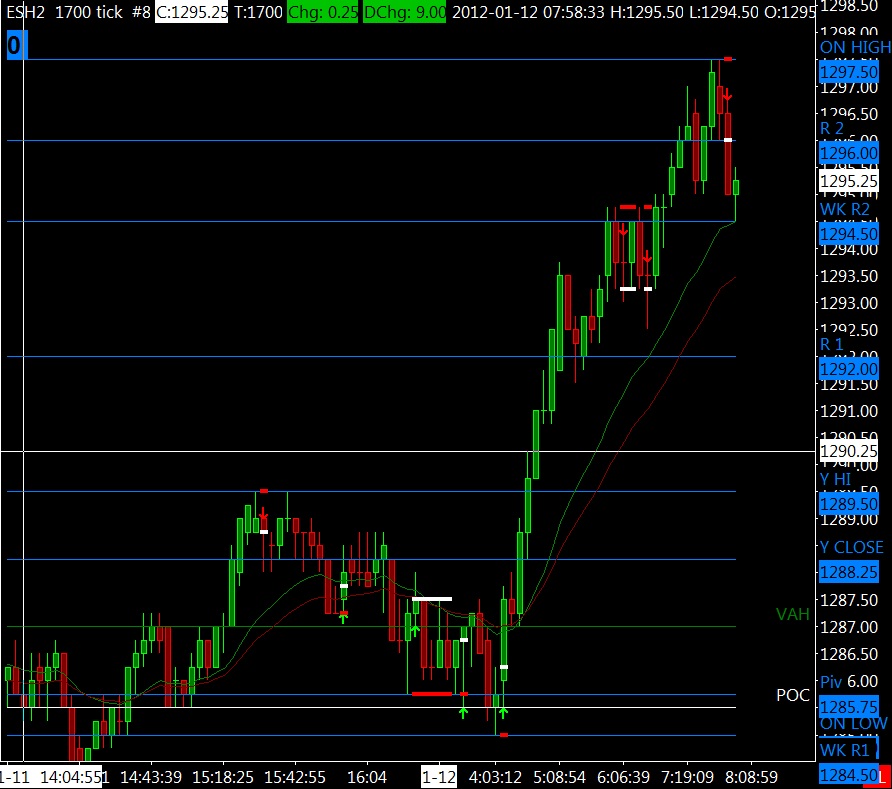
Bruce, This is the delta divergence tool for Sierra charts from the 11th. Might be useful, but only in our key areas, as always.
Click image for original size
waiting for 30 mins looks like it wants to retest top whole numbers 1300
thanks Lovedgor.....
Pitbull can't trade untill a key range is run or a plus or minus 2.5 hits...so today we opened at 96.50, hit the plus 2.5 to the tick so they sold the open print.....
the minus 4 hits into a key number and those of us who are greedy today are trying to hold for that...last weeks RTH high is near there!!!!
so bruce were you trying to hold for 92.5 to get long or to unwind runners ? sorry for the confusion
Nick, the pitbul window is essentially done when it goes 2.5 above AND below the opening...in my case I am not a good stop and reverse trader so I didnot get long today....
as usual we need to be careful with any static number in the emini as there is too much noise...holding out for that last tic with last weeks highs there would have been a mistake...
I had runners that I was working and only did one campaign today..these ranges are just too tight and every 3 -4 points there is another zone...hard to make longer term runners go far with all these damn numbers in the way!
thanks bruce
Originally posted by vasuki
Bruce are you still here?
Look here for current day's trading topic:
http://www.mypivots.com/board/forum/21/1/trading-strategies-and-setups
Emini Day Trading /
Daily Notes /
Forecast /
Economic Events /
Search /
Terms and Conditions /
Disclaimer /
Books /
Online Books /
Site Map /
Contact /
Privacy Policy /
Links /
About /
Day Trading Forum /
Investment Calculators /
Pivot Point Calculator /
Market Profile Generator /
Fibonacci Calculator /
Mailing List /
Advertise Here /
Articles /
Financial Terms /
Brokers /
Software /
Holidays /
Stock Split Calendar /
Mortgage Calculator /
Donate
Copyright © 2004-2023, MyPivots. All rights reserved.
Copyright © 2004-2023, MyPivots. All rights reserved.