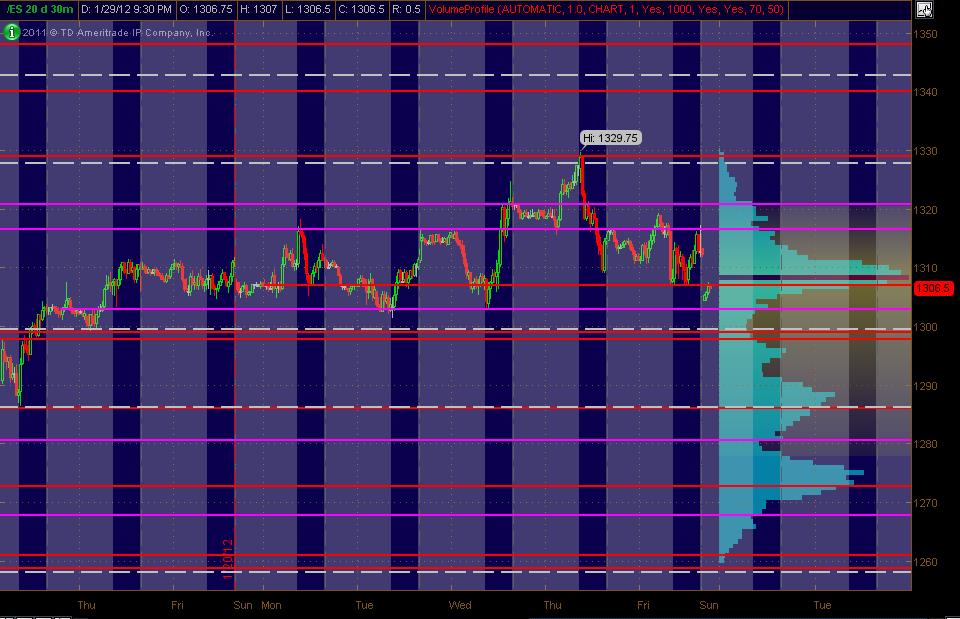
Here's what I've got for my ES MAP of PASR ZONES using a 30min chart of 20 days of data coming into Monday's trading. The Red lines are potential significant levels with Magenta lines as semi-significant. The White dashed lines are the Weekly Pivots (kind of a background thing to have on the chart). The Light Blue Volume Profile of the past "rolling" 20 days is displayed on the right vertical axis. Btw, price lines that are CLOSE together (within a couple of points), should be taken as an overall ZONE. The Gray background shows non-RTH price activity. Hope, as always, that this is helpful to some as a "MAP."
(fyi, drew the lines in on Saturday ... and also, Thinkorswim had data issues coming into Sunday night's session ... thus the data gap)
BR
BruceM
Rep: 216,211
Posts: 19,895
everyone watching last weeks lows at 1301.50 and so will I...below there is the critical 95 - 98.25 as support...then 92.50 and then a big zone at 84- 87
above the low of last week is 1304.50, 1307.50 and then we have 1309 - 1310.50 and then 1314.50...above there is 1317.50 - 1319..still small ranges
without any reports I'm hoping for a first push down to buy into...hopefully below last weeks lows to target all the volume from the ON at 1304.50..
above the low of last week is 1304.50, 1307.50 and then we have 1309 - 1310.50 and then 1314.50...above there is 1317.50 - 1319..still small ranges
without any reports I'm hoping for a first push down to buy into...hopefully below last weeks lows to target all the volume from the ON at 1304.50..
BR
BruceM
Rep: 216,211
Posts: 19,895
L from 98.75...gonna be agressive down here..small losses and multiple tries
BR
BruceM
Rep: 216,211
Posts: 19,895
my third deviation off vwap weekly is 97.50...lots of numbers down here
BR
BruceM
Rep: 216,211
Posts: 19,895
runners for me are trying to get out at 03.75 if I can hold...not convinced that the weekly low and EVIL 1300 is gonna give us that too easy...so far only the minus 2.5 has printed..