ES Tuesday 3-27-12
I just wanted to post a chart here because I didn't think anyone would be going back to yesterday's thread and I am a big believer that a picture is worth a thousand words.
Yesterday at 10:33 I posted the following
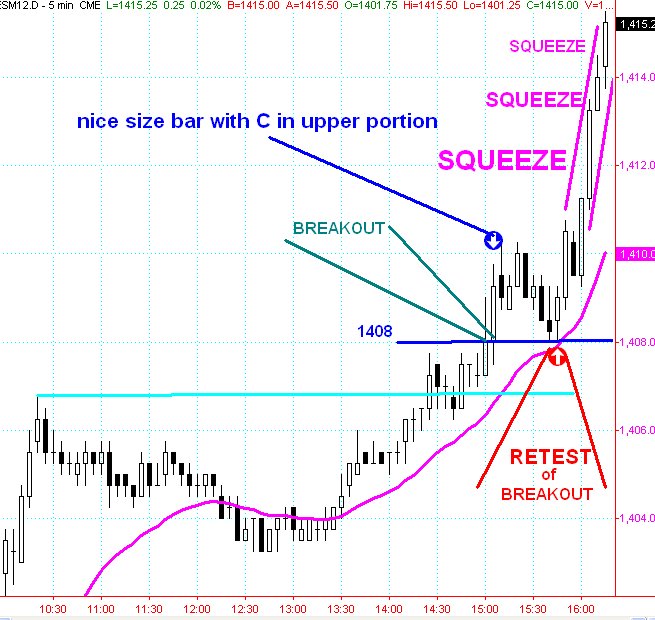
"Price is so close to the monthly R2 ( last week H was 1408.00, that was first test), anyway, price is so close that it would be perfectly natural to test that 1407.50-1408.00 level again.
"if price blasts through it, then longer term time frame breakout players are buying. (price could come back and test the breakout point but if it goes above the high of the first breakout, squeeze de la squeeze"
It is the second paragraph that I am trying to illustrate here.
This is a simple pattern (although usually not so precisely "to the tick" as yesterday) that appears again and again. anyone can file this in the old cranium for future reference.
magenta line on the chart is just 20 period exponential, data is RTH only 5min bars.
Yesterday at 10:33 I posted the following
"Price is so close to the monthly R2 ( last week H was 1408.00, that was first test), anyway, price is so close that it would be perfectly natural to test that 1407.50-1408.00 level again.
"if price blasts through it, then longer term time frame breakout players are buying. (price could come back and test the breakout point but if it goes above the high of the first breakout, squeeze de la squeeze"
It is the second paragraph that I am trying to illustrate here.
This is a simple pattern (although usually not so precisely "to the tick" as yesterday) that appears again and again. anyone can file this in the old cranium for future reference.
magenta line on the chart is just 20 period exponential, data is RTH only 5min bars.
Click image for original size
Today is MATD so we need to try harder to buy the breaks and sell the rallies. Harder than usual.
Lots of numbers coming in at 1408 - 1410.50 ...va's, weekly highs, pivot points...key magnet is 1415-1416
Lots of numbers coming in at 1408 - 1410.50 ...va's, weekly highs, pivot points...key magnet is 1415-1416
I think it will be a gift for longs if they push out that On low BEFORE the retest 1415..
starting second try in day session at 1411... Prepared to take multiple tries under that O/N low for the 1415 retest...less agggressive traders will wait till we get back above the O/N lows
taking something off at 1413 and holding runners for new highs...triples up there at 1414 as a bonus but not my favorite thing as a target...bell curve of On and MATD is the reason to fade this decline
internals are still neutral so we are still in a buy the break mode..even on new lows into 1408.50 if it comes. we can monitor how much time is spent in the day session above and below the O/N lows. Then things may change if that changes but for now all the time is above that low..so I'm buying these breaks
where's jedi?
I need an interpretation of the VOLD. I stuck it onto a chart and put a horizontal line at zero (did that a couple weeks ago), and right now, you can't even see the VOLD bars (the horizontal line is thicker than the entire range of the VOLD so far today.
It is just flat.
I need an interpretation of the VOLD. I stuck it onto a chart and put a horizontal line at zero (did that a couple weeks ago), and right now, you can't even see the VOLD bars (the horizontal line is thicker than the entire range of the VOLD so far today.
It is just flat.
starting a new campaign at 1410.25 . this is one of those days where we take something off and runners just keep getting stopped...that's ok...we are now finally in key zone of support..will look for two points and then tighten stop again...still neutral internals
Paul, a look at my cummulative $tick..lower pane making higher highs as we are giving the illusion of wedging down..certainly not perfect but the fact that we are above zero and making higher lows is encouraging to help fades down here.
Click image for original size
I would assume bigger players are using the declining prices to put on some longs under that scenario, Is this a correct interpretation?
right now, with a failure to hold above yesterday's H, I am inclined to wait for a test of 50% of yesterday's range, namely 1408.50 area, that was also last week's RTH H. hmmmm
right now, with a failure to hold above yesterday's H, I am inclined to wait for a test of 50% of yesterday's range, namely 1408.50 area, that was also last week's RTH H. hmmmm
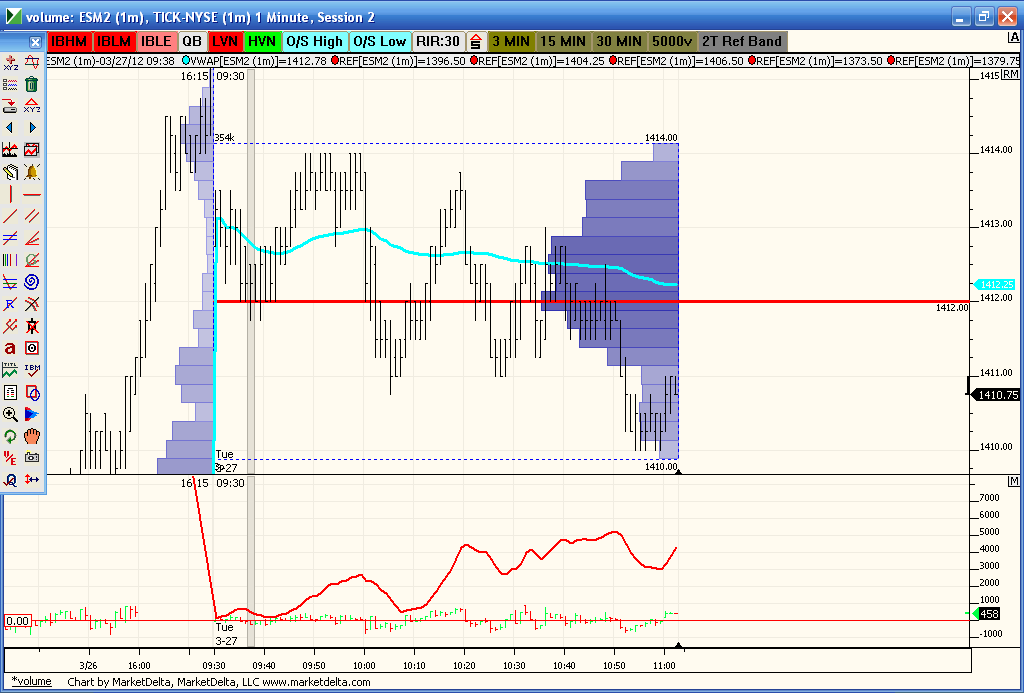
peak volume and vwap right at my first target of 1412...lets see if this magnet can attract..sure wish that was a better low but harder to read lows and highs in such poor volume
I didn't exit on the new low due to the shape of the current bell curve and my bigger plan was to buy in the 08 - 1410.50 zone anyway.
since this morning was good I am holding this and will exit with a 30 minute close under 1408.50 or new highs on the day whichever come first. This is a revised strategy for me and is based on a longer term view. Not my usual style so I am willing to take a slightly bigger risk instead of having to actively trade in here now.
We are getting to that time of day soon where they should decide on some direction soon. The peak volume price is currently higher that yesterday and we have consolidated above yesterdays VA highs. Logically value is higher but we'll see if price follows logic today.
cummulative $ticks are still in an uptrend..
Emini Day Trading /
Daily Notes /
Forecast /
Economic Events /
Search /
Terms and Conditions /
Disclaimer /
Books /
Online Books /
Site Map /
Contact /
Privacy Policy /
Links /
About /
Day Trading Forum /
Investment Calculators /
Pivot Point Calculator /
Market Profile Generator /
Fibonacci Calculator /
Mailing List /
Advertise Here /
Articles /
Financial Terms /
Brokers /
Software /
Holidays /
Stock Split Calendar /
Mortgage Calculator /
Donate
Copyright © 2004-2023, MyPivots. All rights reserved.
Copyright © 2004-2023, MyPivots. All rights reserved.