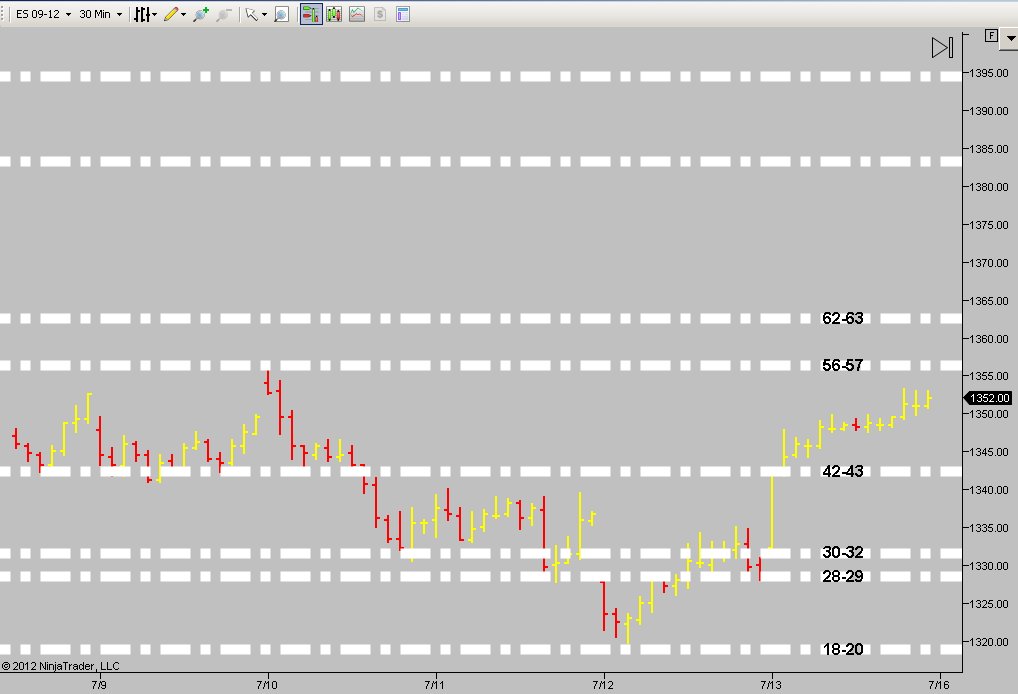
Chart for start of week 7/16
Here are my significant S/R levels going into the week. Have some other minor levels but this is the bulk of the framework. Good luck to all.
Click image for original size
Nick...if you look where the actual buying came in on the VERTICAL volume scale......big volume nodes at 1342.25 and 1344.50.....these big volume nodes on the vertical scale is what creates LOW volume nodes on our volume histograms as per Volume profile studies.....
I always want to know both just to be sure...I want to know the exact tic that somebody with more money than all of us came into the market
these exact tic volume nodes get tested often....especially as they form intra day...so if you see one form you should monitor what happens around them....I use them as magnet prices as I haven't fiqured out a better use for them.....YET !!!
remember today may be the MATD day so look to buy breaks with proper setups early
lots of good volume coming into our numbers down here...lets hope for a flip in delta....worst case is they blow through this zone and then we use it as a target from below...either way ..watch this 42.25 - 44.50 !!
That Low print was also a fill of single prints from Friday
Textbook today gentlemen. Opened in value, one 30 minute close outside-below, tested S/R level and rotated nearly through to other side of the value range.
Good luck to all. Maybe we can get forum livened up a bit again!
Good luck to all. Maybe we can get forum livened up a bit again!
Low print was also within a tick or two of a 50% retracement from Friday's RTH. Now we just have to get through our ETH open and Friday's settle. Looks like internals are about to go positive too.
that 1350.50 - 1352 looks sloppy to me.....something strange about it now with those gaps all around it.....watching to see if we can get some failure near 1356.50...
no failure tells me they will try to push for the next key area up at 1361.50 and my narrow focus will miss any longs up here...only short pokes for me.
so three main areas and I have no good clue what will happen yet...does anybody ??
no failure tells me they will try to push for the next key area up at 1361.50 and my narrow focus will miss any longs up here...only short pokes for me.
so three main areas and I have no good clue what will happen yet...does anybody ??
if we can get back below the IB high I will start hunting for shorts thinking that this neutral day may want to close near the center and that 50% mark is just under that 50.50 - 52 area now
not trading anymore today but i have 60.5-61.5 above today's highs and then 65.5-66.5 above that
well I'm trying from 59.25 for that 56 area first...I missed this mornings session and may be a bit impatient.....that 61.50 is close by for my stop loss
Originally posted by rburns
Sorry but I was not aware that there is a stretch calculation daily on this site. Can some one pls point me to it
http://www.mypivots.com/dailynotes
Emini Day Trading /
Daily Notes /
Forecast /
Economic Events /
Search /
Terms and Conditions /
Disclaimer /
Books /
Online Books /
Site Map /
Contact /
Privacy Policy /
Links /
About /
Day Trading Forum /
Investment Calculators /
Pivot Point Calculator /
Market Profile Generator /
Fibonacci Calculator /
Mailing List /
Advertise Here /
Articles /
Financial Terms /
Brokers /
Software /
Holidays /
Stock Split Calendar /
Mortgage Calculator /
Donate
Copyright © 2004-2023, MyPivots. All rights reserved.
Copyright © 2004-2023, MyPivots. All rights reserved.