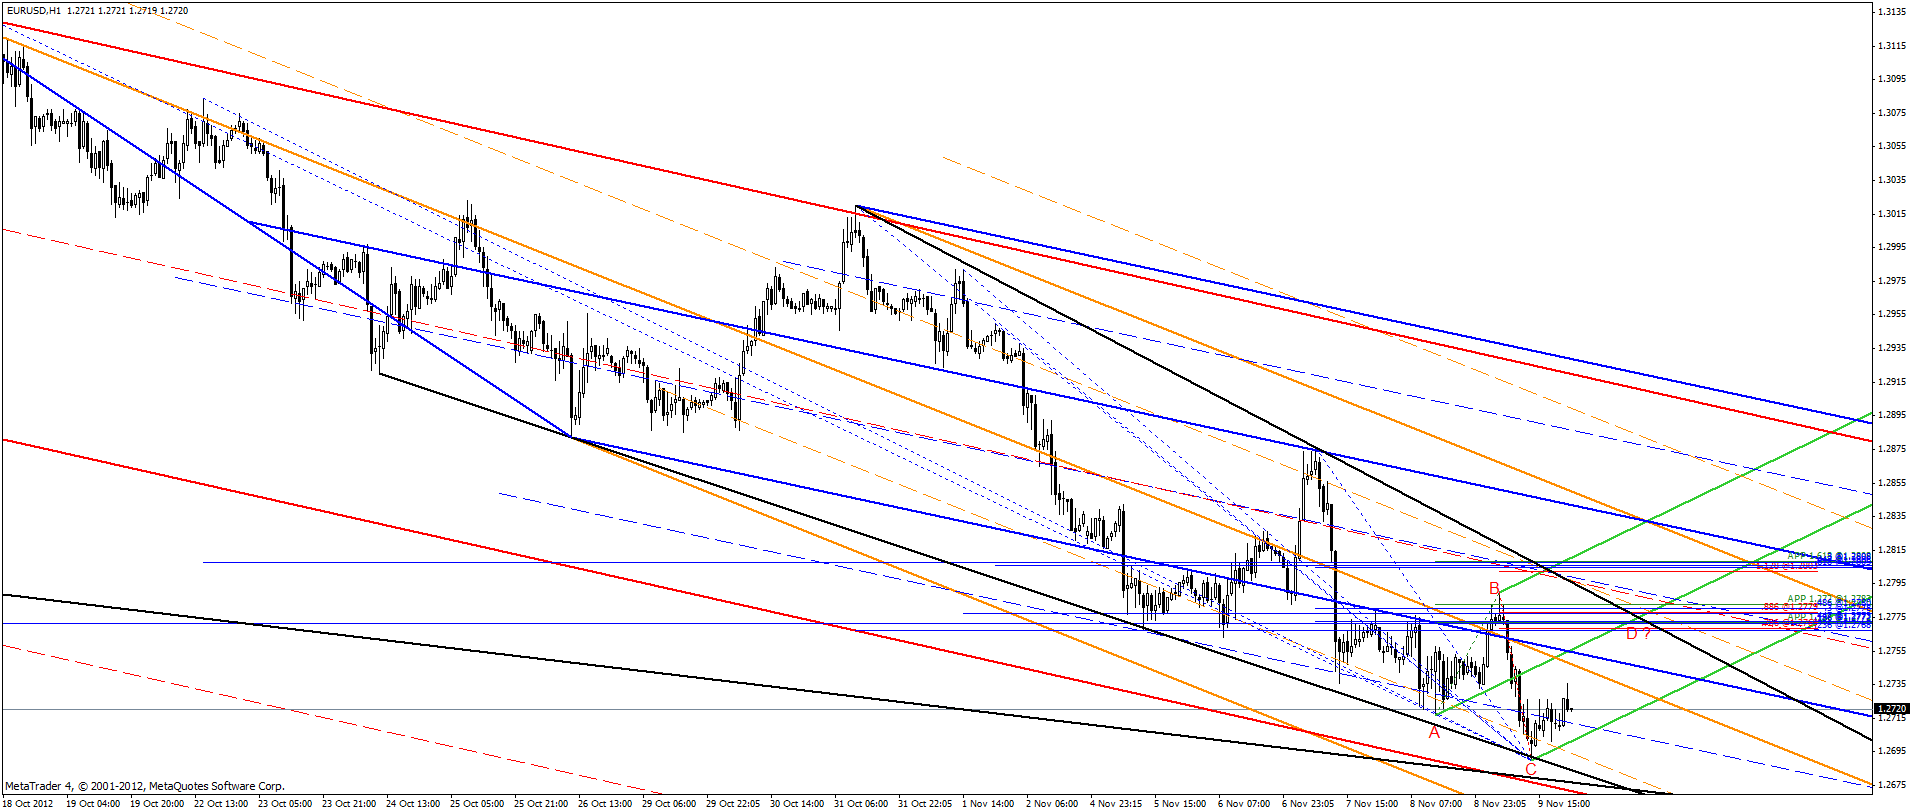
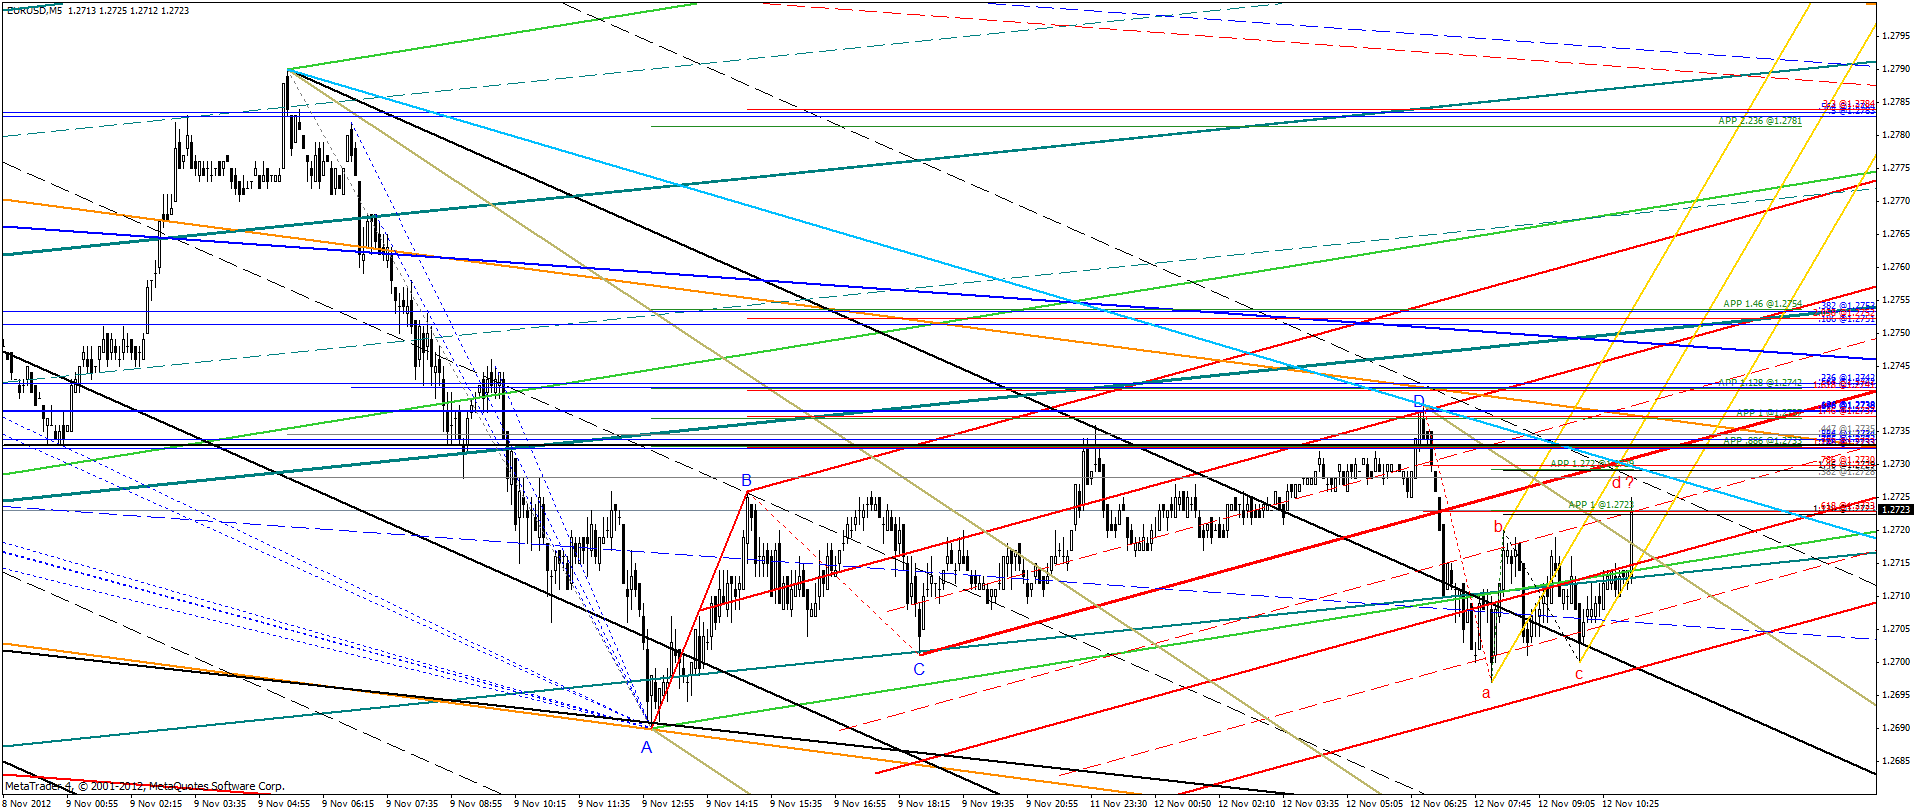
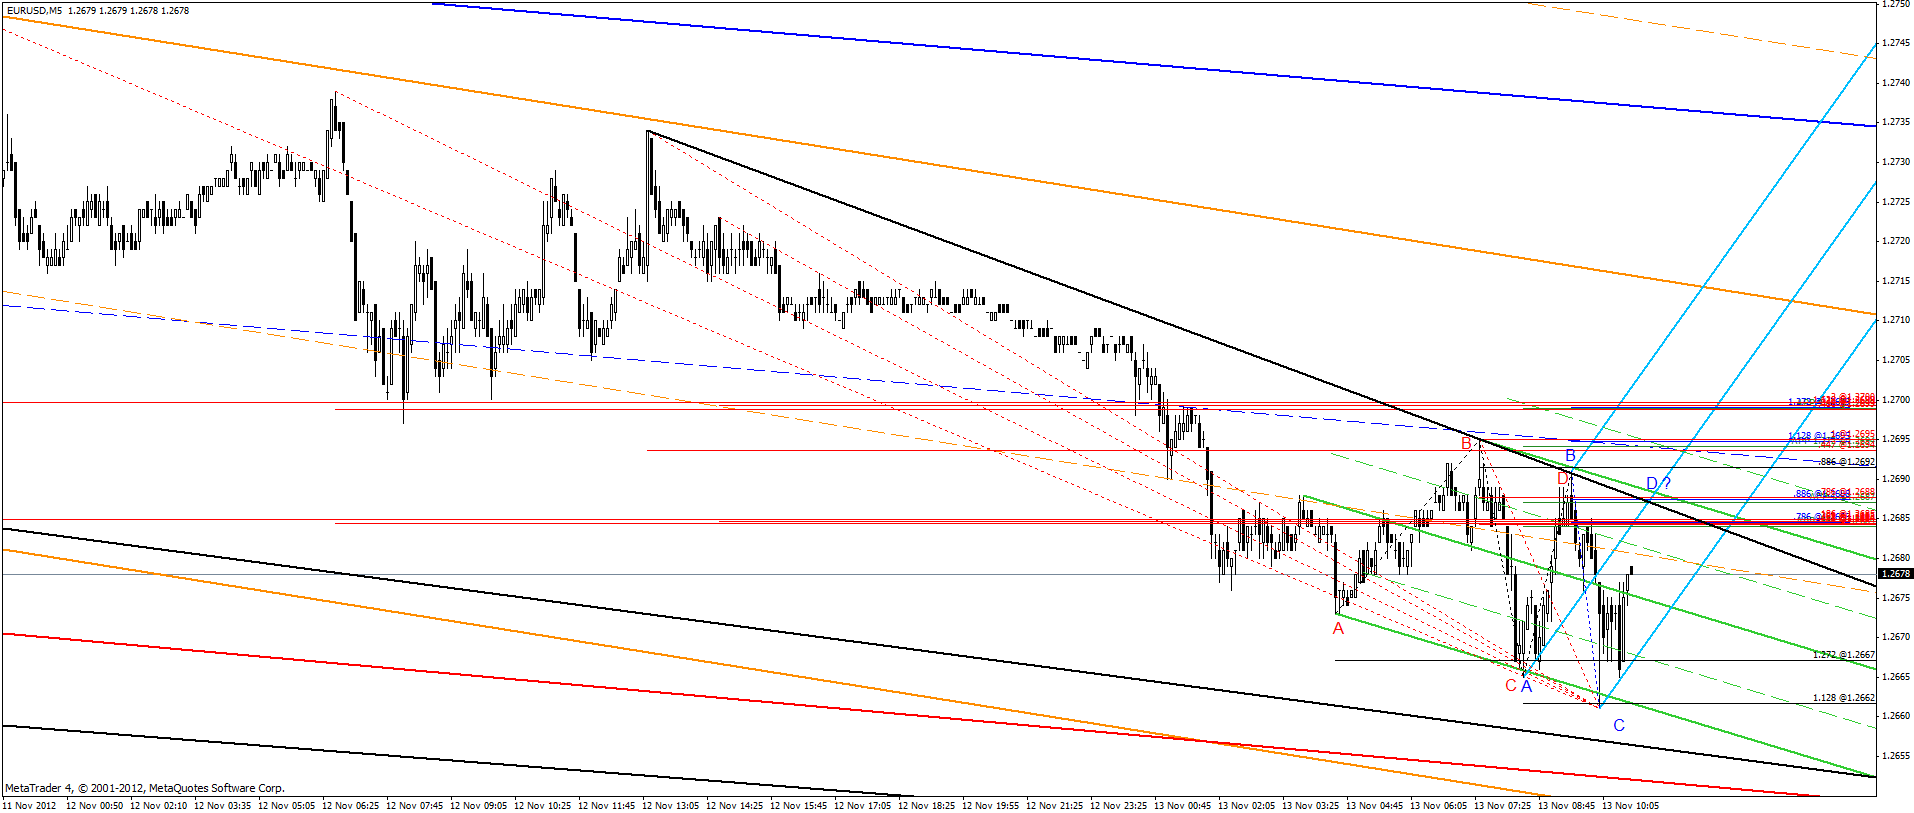
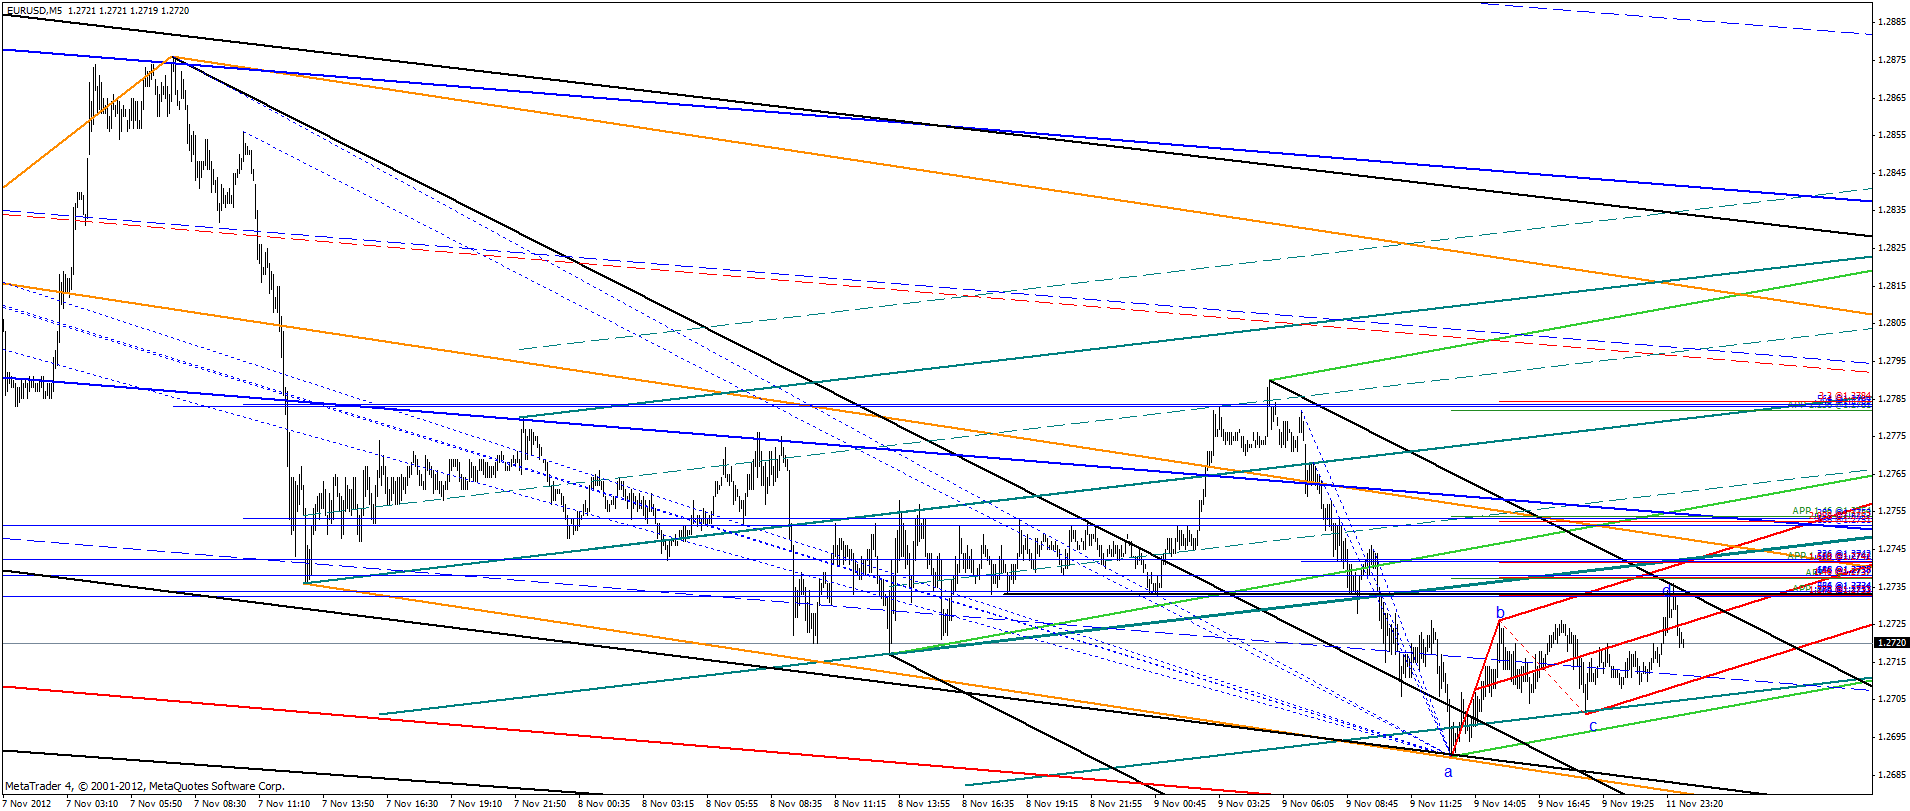
Some areas, in case the lowest one will not hold.
JI
jimkane
Rep: 3,058
Posts: 33,089
Nice chart, rat. I was thinking, you know what would be very helpful to the readers I think, myself included, is if you could expound on your charts from a trading perspective. In this forum there is a lot of emphasis on posting areas (I think that's a throwback to forum behavior in general, and the conditioning we all get from all the false guru's out there selling products that focus only on the setups), and that's only 10%-20% of my 'Trading Plan', for example.
If you could discuss some entries on various trades you take, maybe some charts on that, stop placement, some exits, and how various trades played out, both home runs, partial winners, break even trades, stop outs, etc., I think that would help the readers out tremendously. If you would be willing to do it... I know it's easier, and way more fun, to post setups and current layouts, but you have so much to potentially contribute, it sure would be nice to see some trade sequences. Anyway, just a request. If you want to go on as you are, that's fine, too. We'll take what we can get.
RA
rat89
Rep: 0
Posts: 7,015
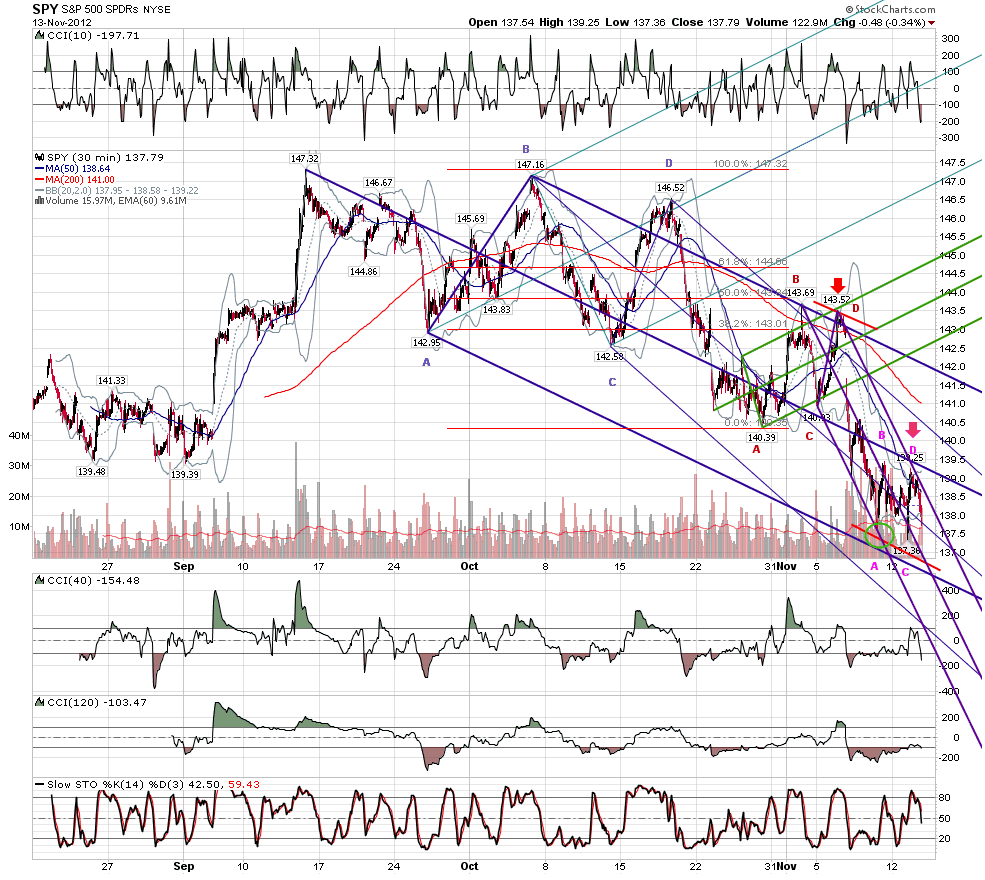
hey jim....basically i'm viewing this a one big trend day down with three major abcd continuation entries at confluence of fibs and line. the up moves have been playable with tighter stops, but the fact that the lower line hasn't even gotten close to hit until the last three trading days has me giving more leeway to short entries. I'm usually placing a stop at 1/5 of the length to the minimum target and often not still in much past the median line in each case depending on how the day is playing out. I don't usually move my hard stop past break even, but will start exiting partial positions along the way as a way of reducing risk.
also, this is in the context of the daily chart...
JI
jimkane
Rep: 3,058
Posts: 33,089
Great stuff, rat. Now, when you say 1/5 of the way to the target area for the stop, is that amount beyond the reversal point, or from entry? And, what triggers you to enter? In other words, it's moving to the area, how are you personally making that decision at that moment that 'now it's time'? Thanks in advance.
RA
rat89
Rep: 0
Posts: 7,015
my decision on entry is hopefully at or near the point where price is ready to reverse. not the easiest thing to figure out, and exactly the opposite of what all the breakout traders are doing. In certain scenarios the reversal area is right in the context of an expected continuation marked out by an abcd ending at a significan fib area, my favorite being in the kz.
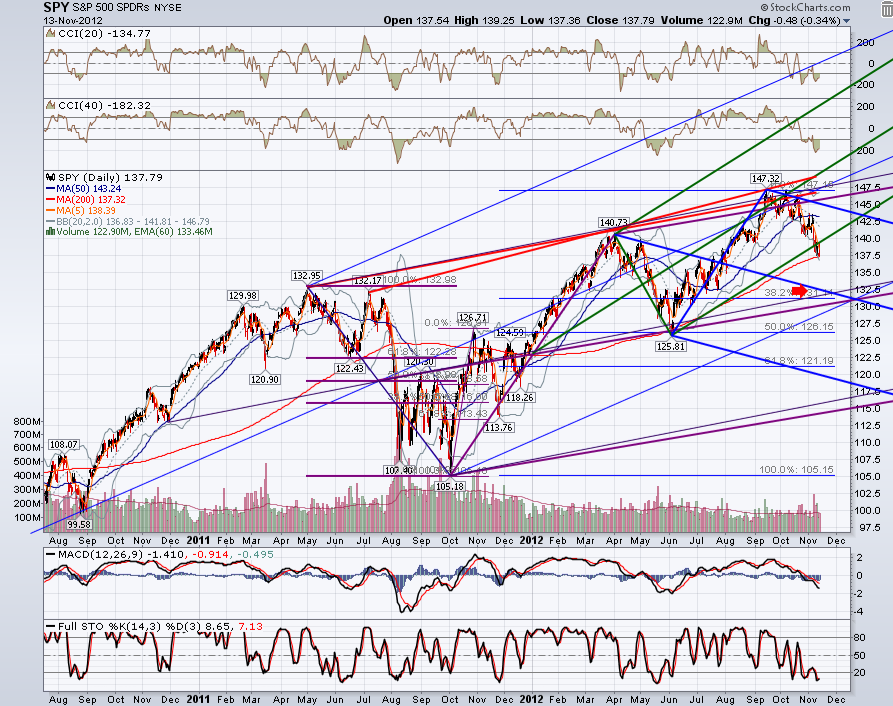
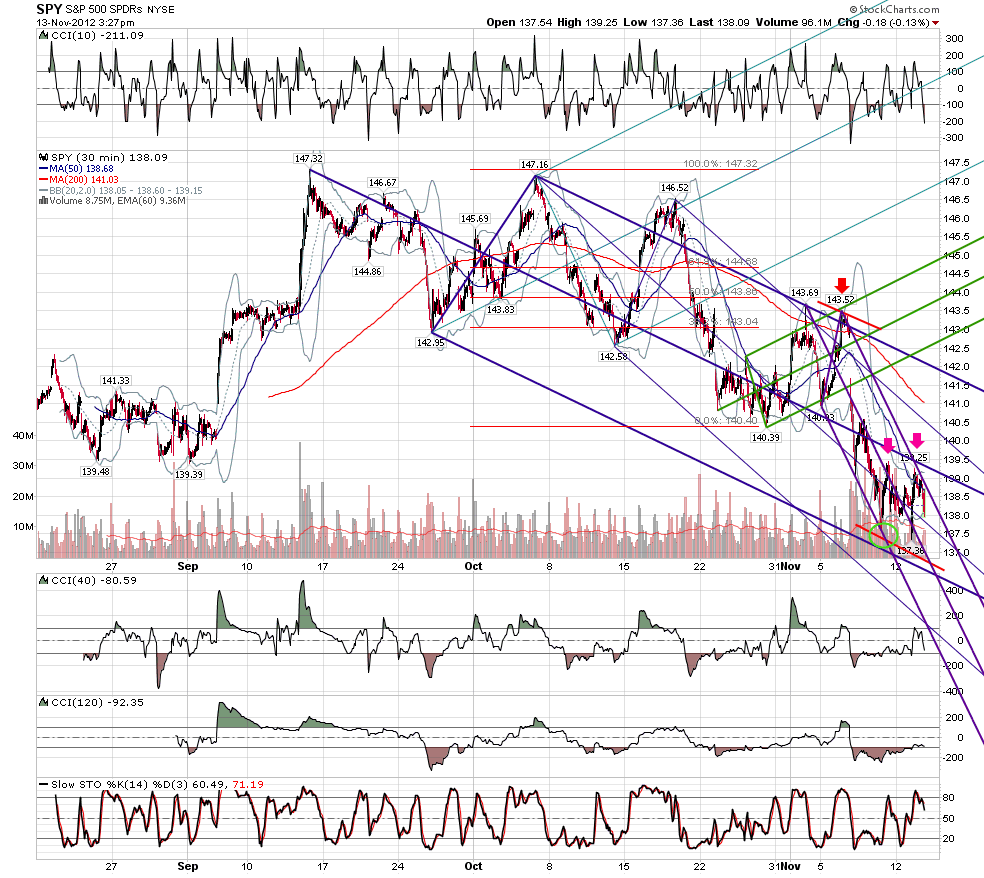
if you look at the nov12 swing high of 143.52 price has jumped the upper blue line to hit the upper green line at the .942, while the cci 10 says not to push long. add the extreme purple median line set and aim for initial target where the two median lines meet at about 140. divide that distance by 5 to set a stop above the entry, though in this case I cut that almost in half because a move against the short by more than 40¢ or so would say the trade isn't there the way I see it. the danger is always that someone or something is out there that is way smarter than you and sees something you're not seeing.
next, lets fast forward to today....you have a low of 137.36, which was basically the 1.128 of the upswing from 137.55 - 139.44. I didn't trade that long because I didn't feel the low target that would get me in long had been hit, so I was not on board for the sharp upswing. which stalled at 139.20 - measuring off the swing high of 139.44 to the low at 137.36 you get .886 at 139.20. off the minor high of 138.81 to the low you get 1.27 at 139.20. this coincides with magenta D at the high this morning, and to me that says you go in with a tight stop. in this case i hit .19 and put a .22¢ stop on it. IF this was a continuing trade I would hold for the lower line or the red harmonic, BUT i went out at 137.78 a couple of minutes before the close right in the game zone.
I have my eye on a potential long that looks to come up sometime tomorrow and I am looking at the 137.04 - 136.85 area (double 1.27 off last two lows) or 136.19 - 136.38 (triple 1.618 when you include the swing from 140.39 - 143.69).
that could be a completion of 5 waves down and be the low needed to bounce it up far enough to allow it to get to the bigger target on the daily.
JI
jimkane
Rep: 3,058
Posts: 33,089
Now that's an answer. Nice detail, rat. I'm sure that's helpful for everyone. I did have a question, when you say "while the cci 10 says not to push long" do you just mean the CCI is up in the upper range and not in the position for a long? So you take that as good because you want to go short there? If there is more to this, please let me know. I'd like to understand more about how use use your indicators. Thanks.
RA
rat89
Rep: 0
Posts: 7,015
ideally i'm watching the larger cci's for a series of lows(highs) that diverge from price. multiple cci's on a chart is a way of having a view of multiple time frames.
the cci 10 is very quick, obviously. watch for it to be in sync with the 40, not against it around an entry...watch for price reversals where price barely moves and the cci 10 goes up and over....price isn't ready....in this case it was simply cci 10 is cycling over the top. the cci's are time.
my approach is part roofer, part kane, part wolverine....all masters of time, which is the most important part of trading
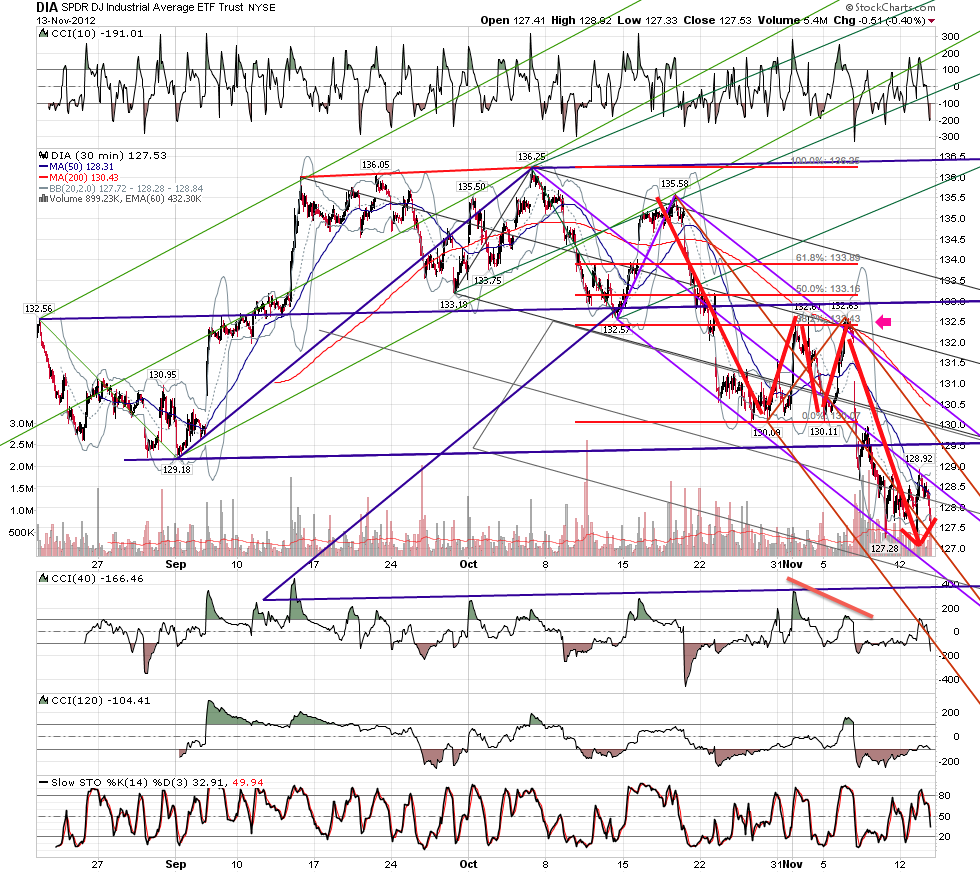
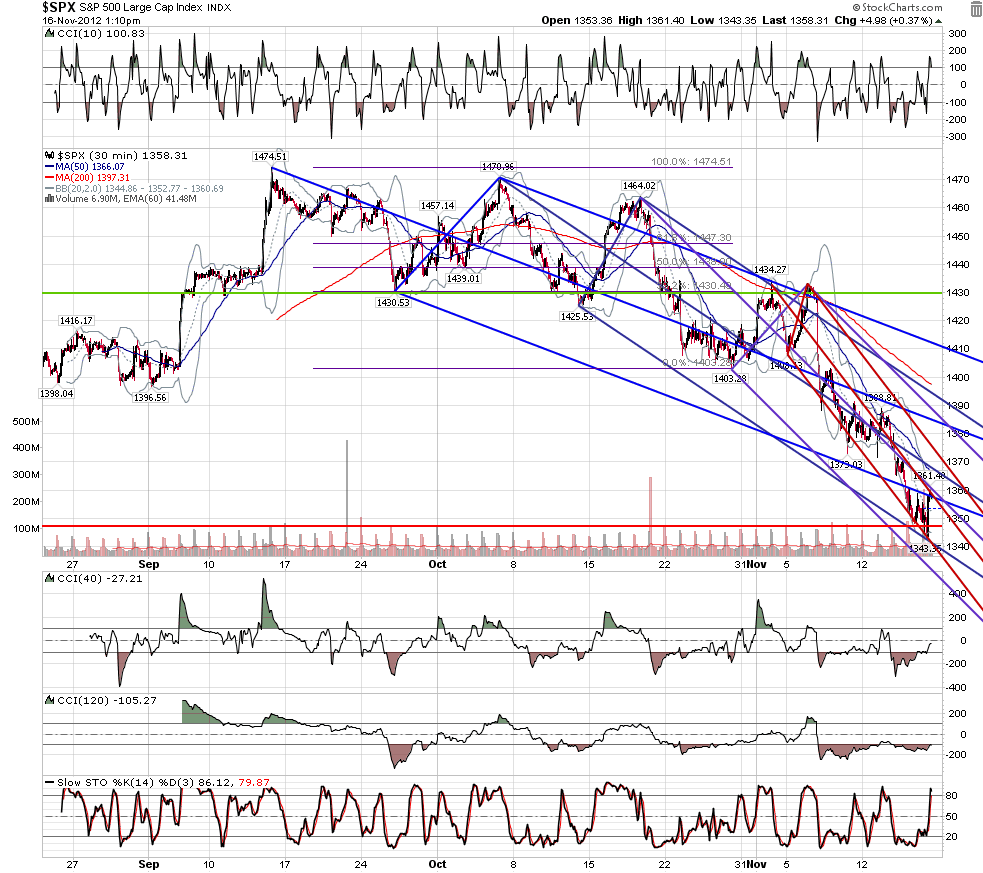
here is dia....look at the abcd to kz in red...classic kane + resistance at established lines...at the red arrow look at the last two peaks of cci 40....price makes higher high to fib and line, cci makes lower high....the computers are good...they do it right into the close on election day!
Originally posted by jimkane
Now that's an answer. Nice detail, rat. I'm sure that's helpful for everyone. I did have a question, when you say "while the cci 10 says not to push long" do you just mean the CCI is up in the upper range and not in the position for a long? So you take that as good because you want to go short there? If there is more to this, please let me know. I'd like to understand more about how use use your indicators. Thanks.