MA
MarcinO
Rep: 67
Posts: 5,506
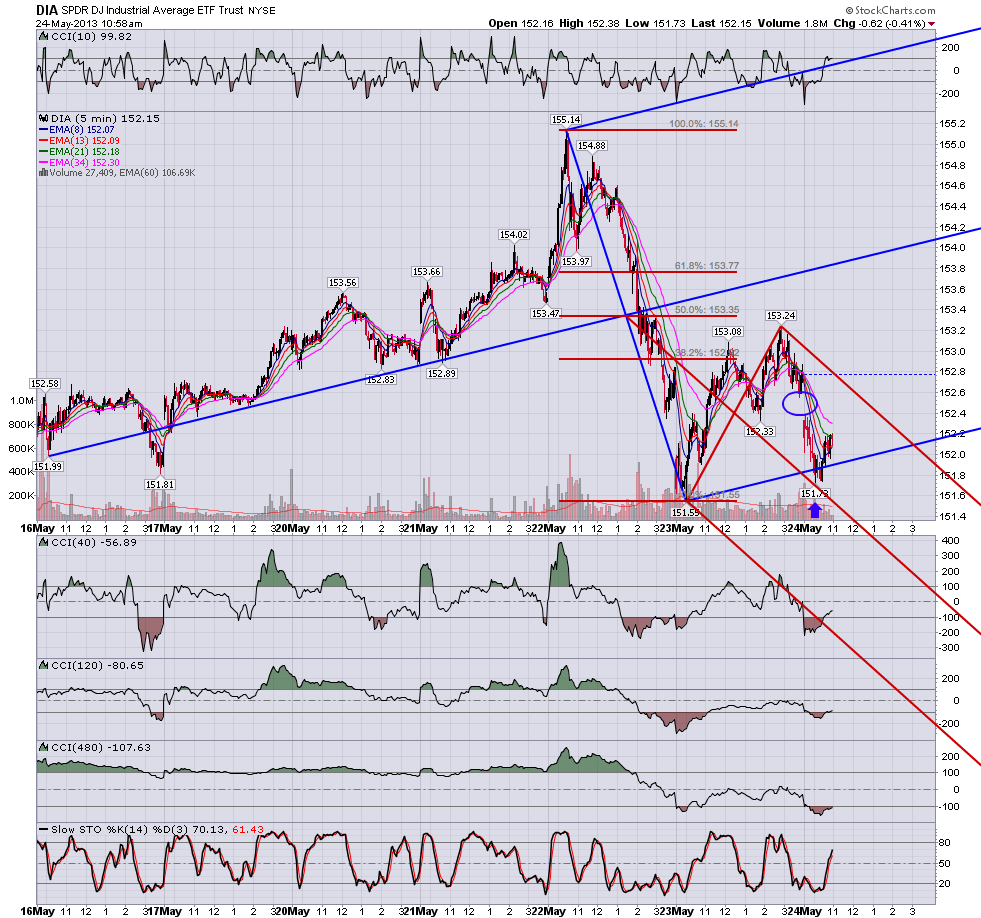
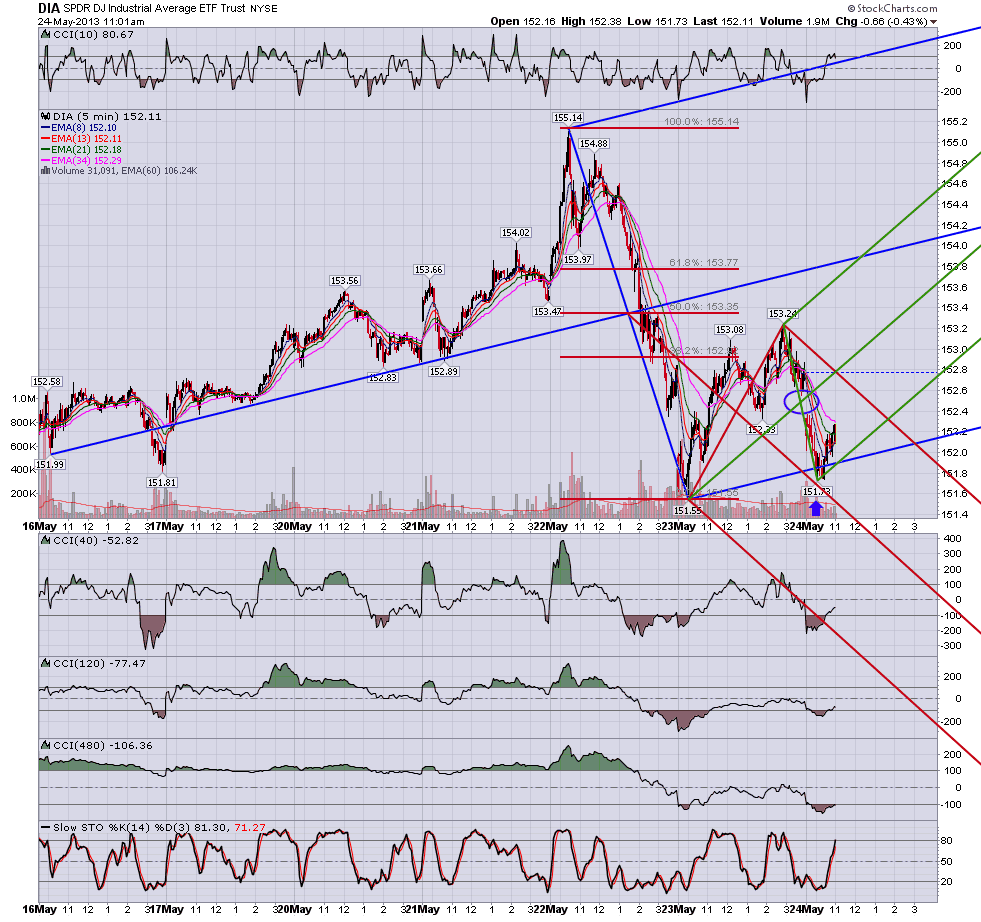
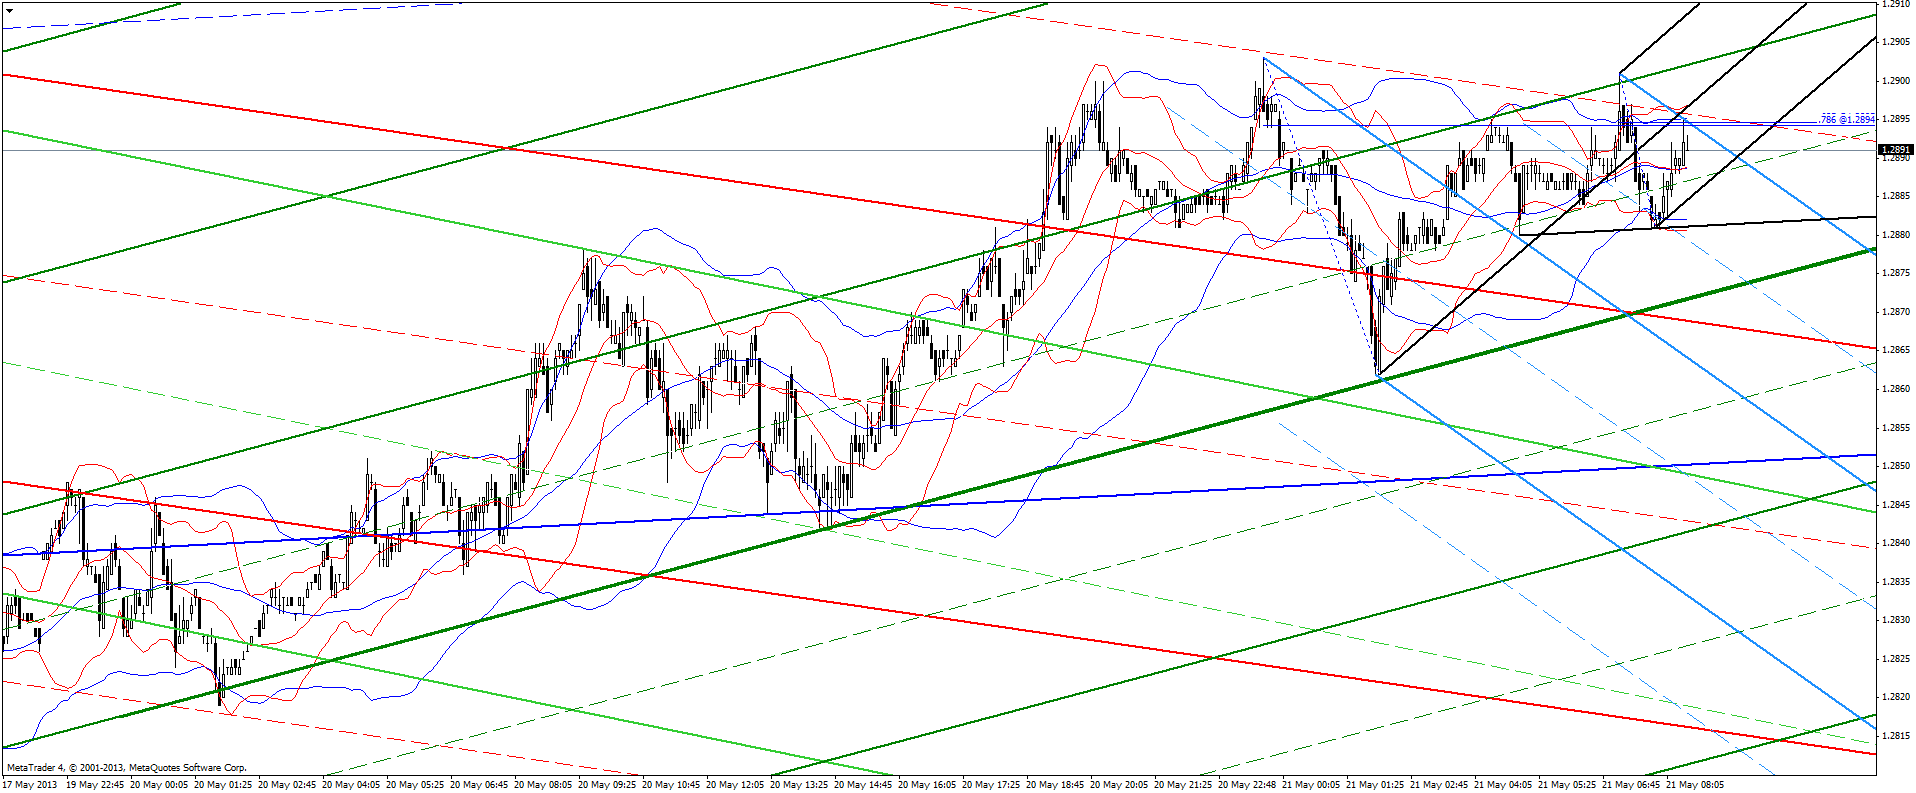
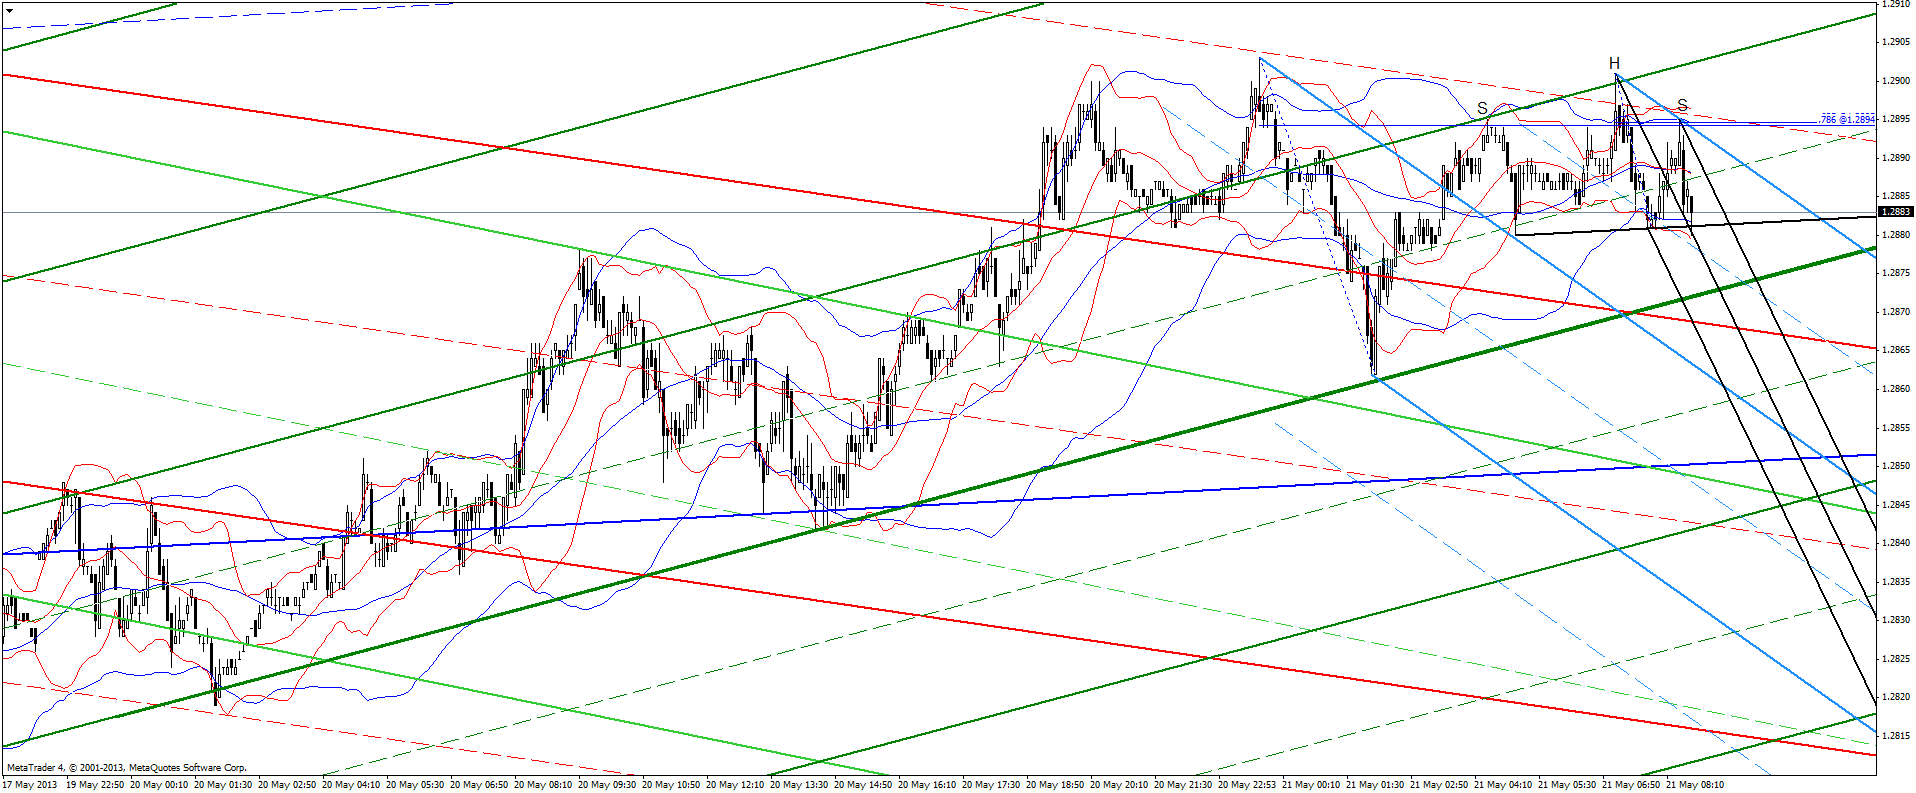
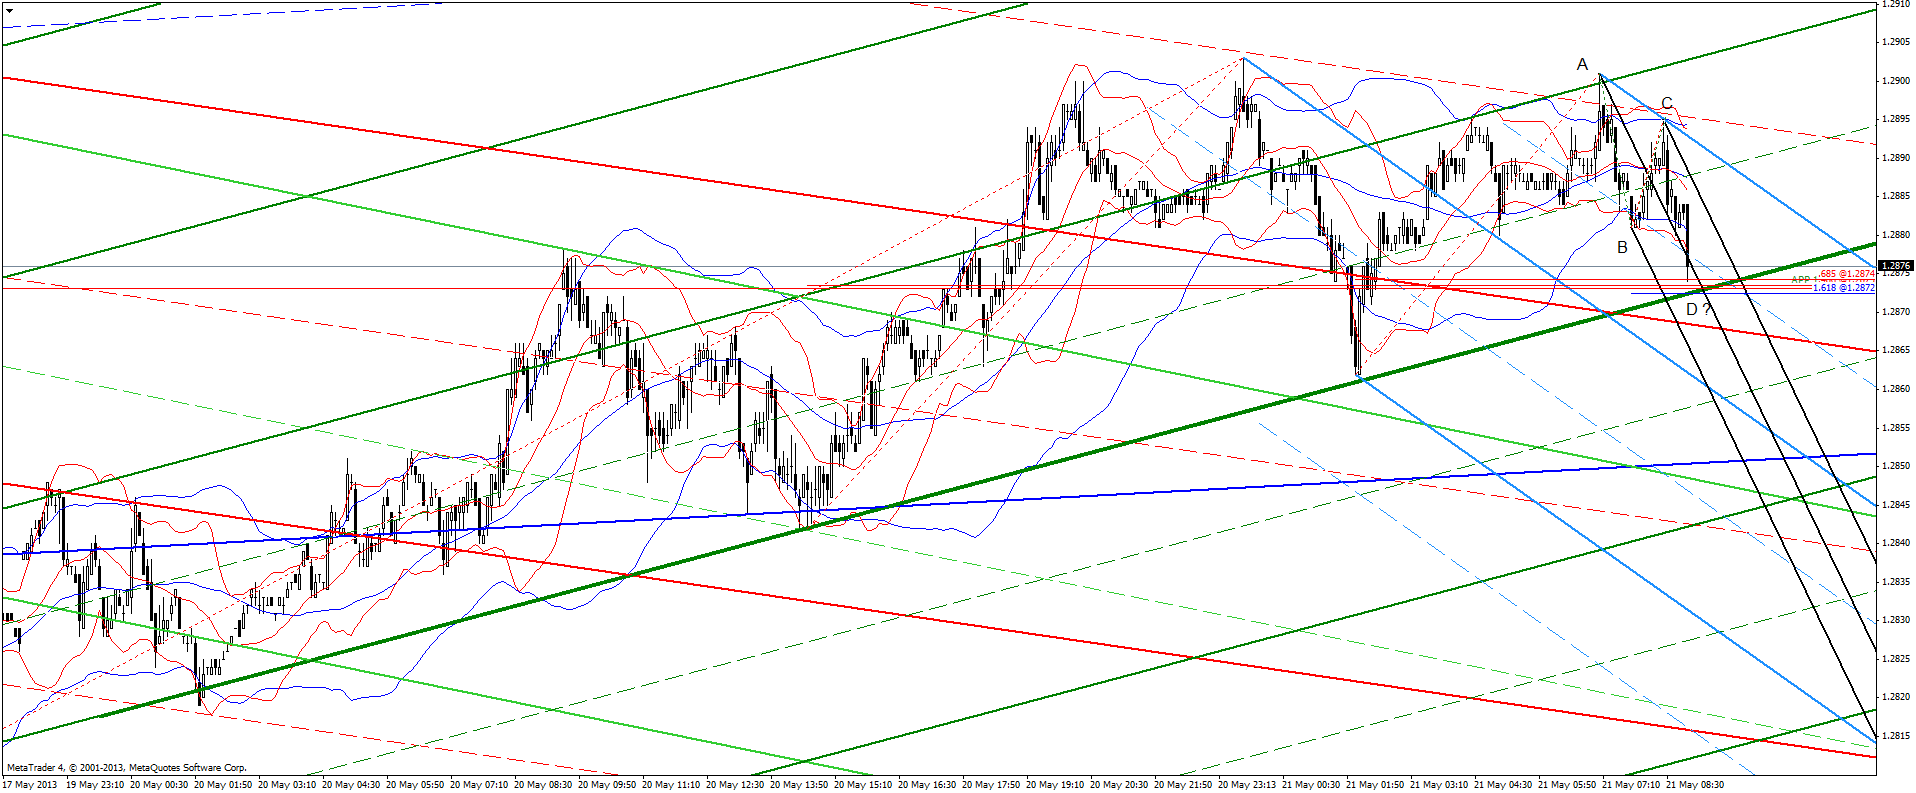
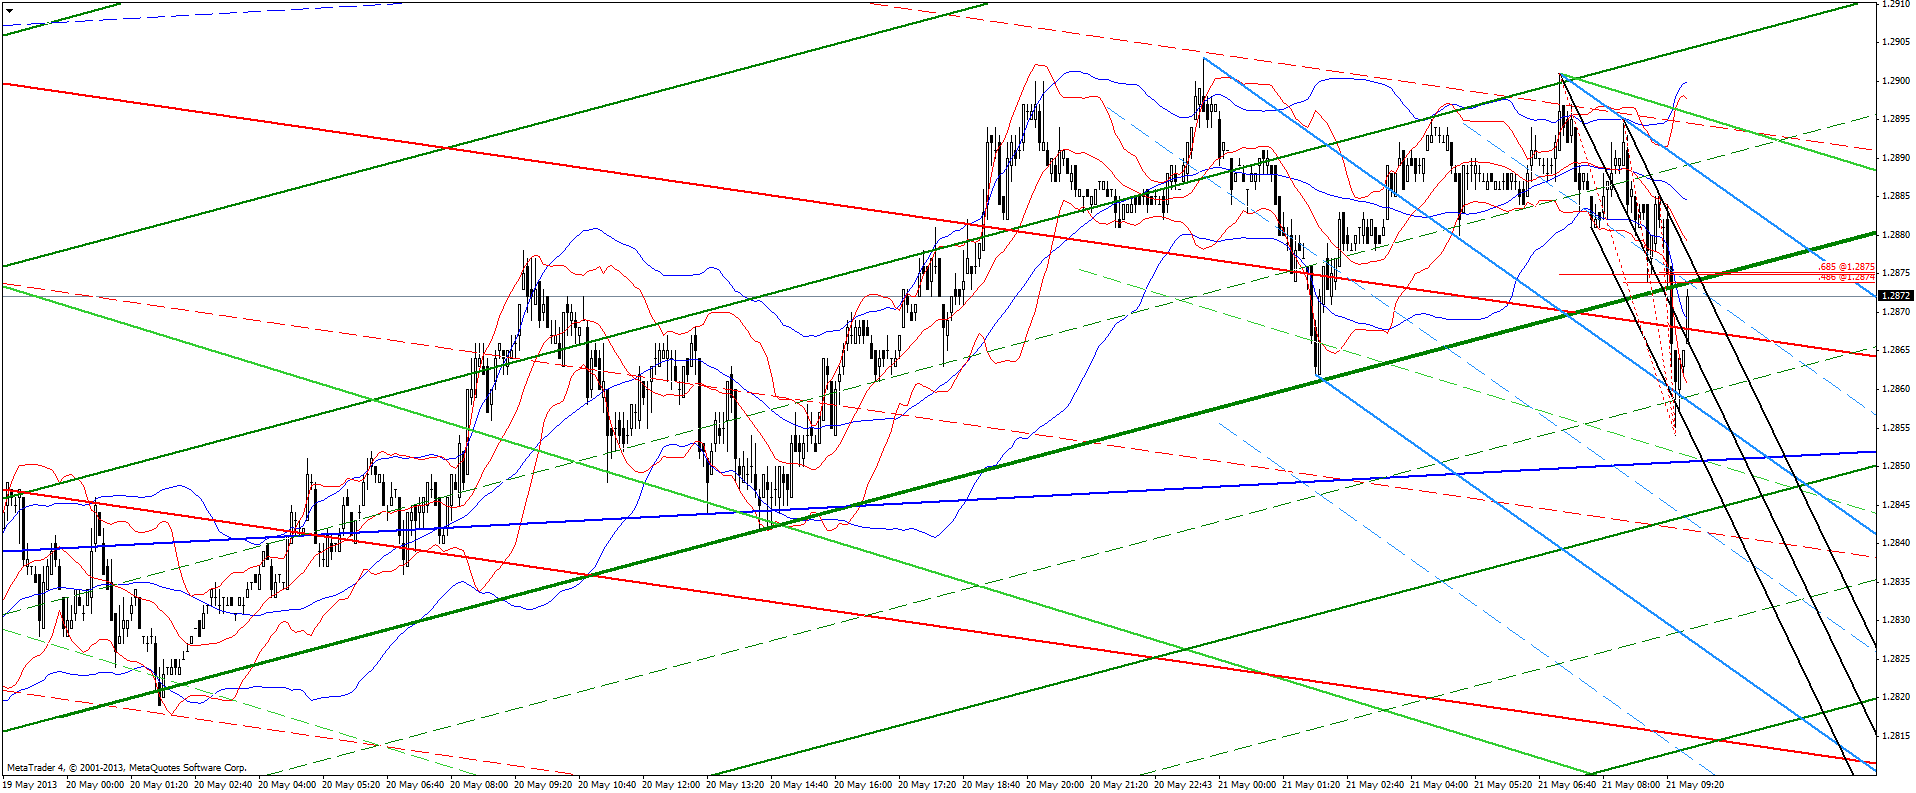
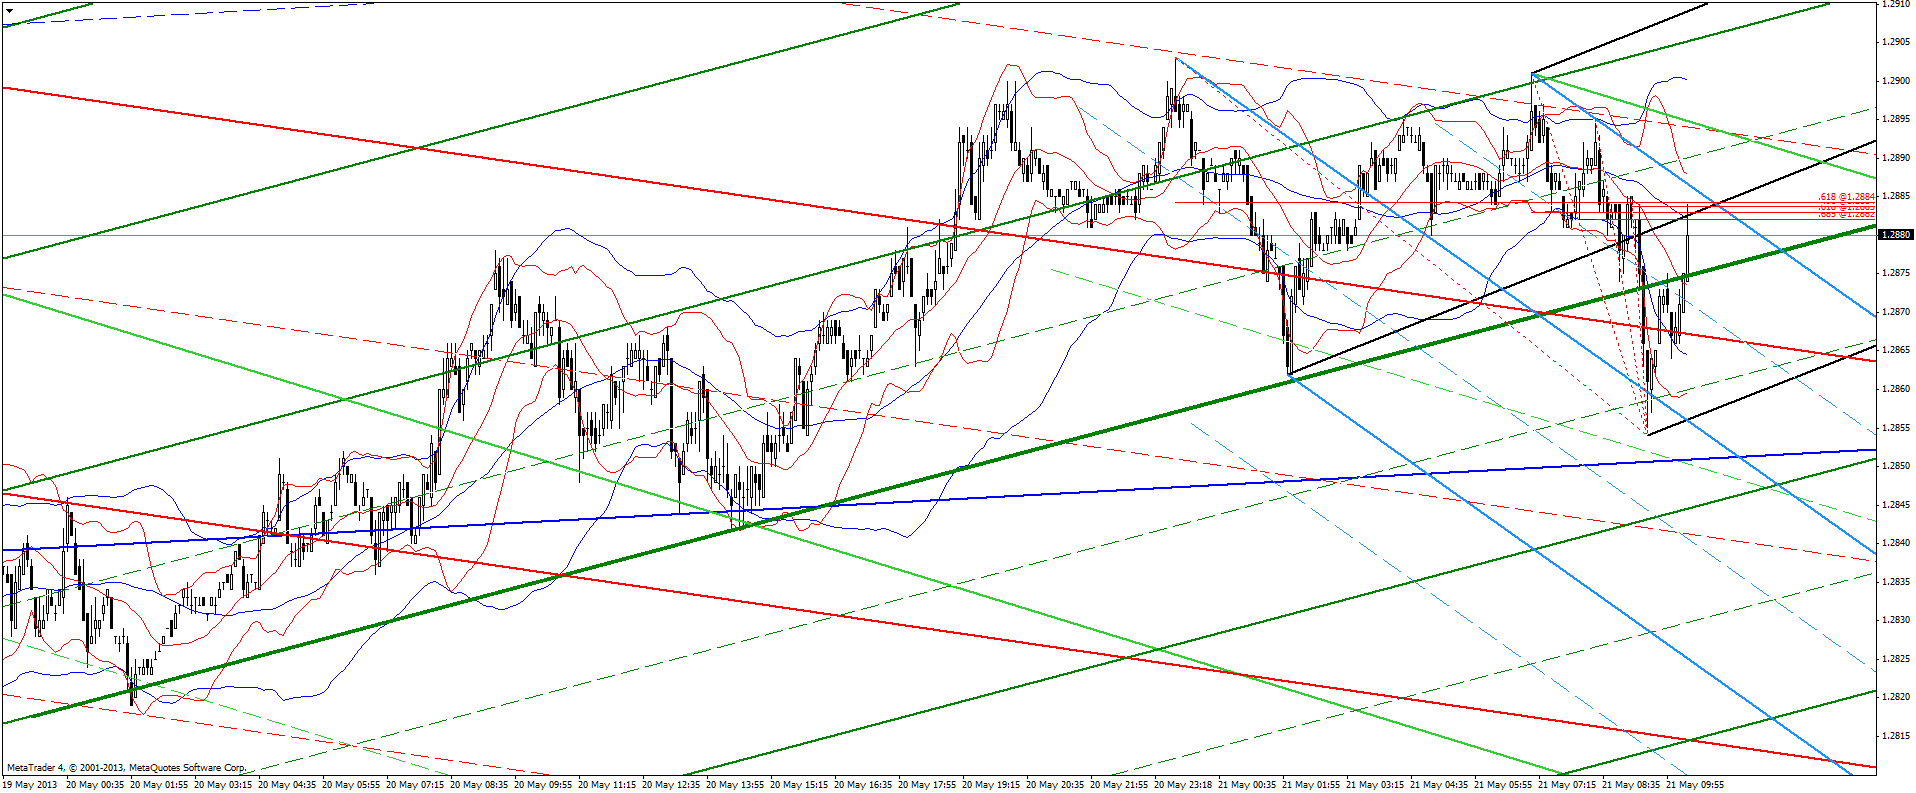
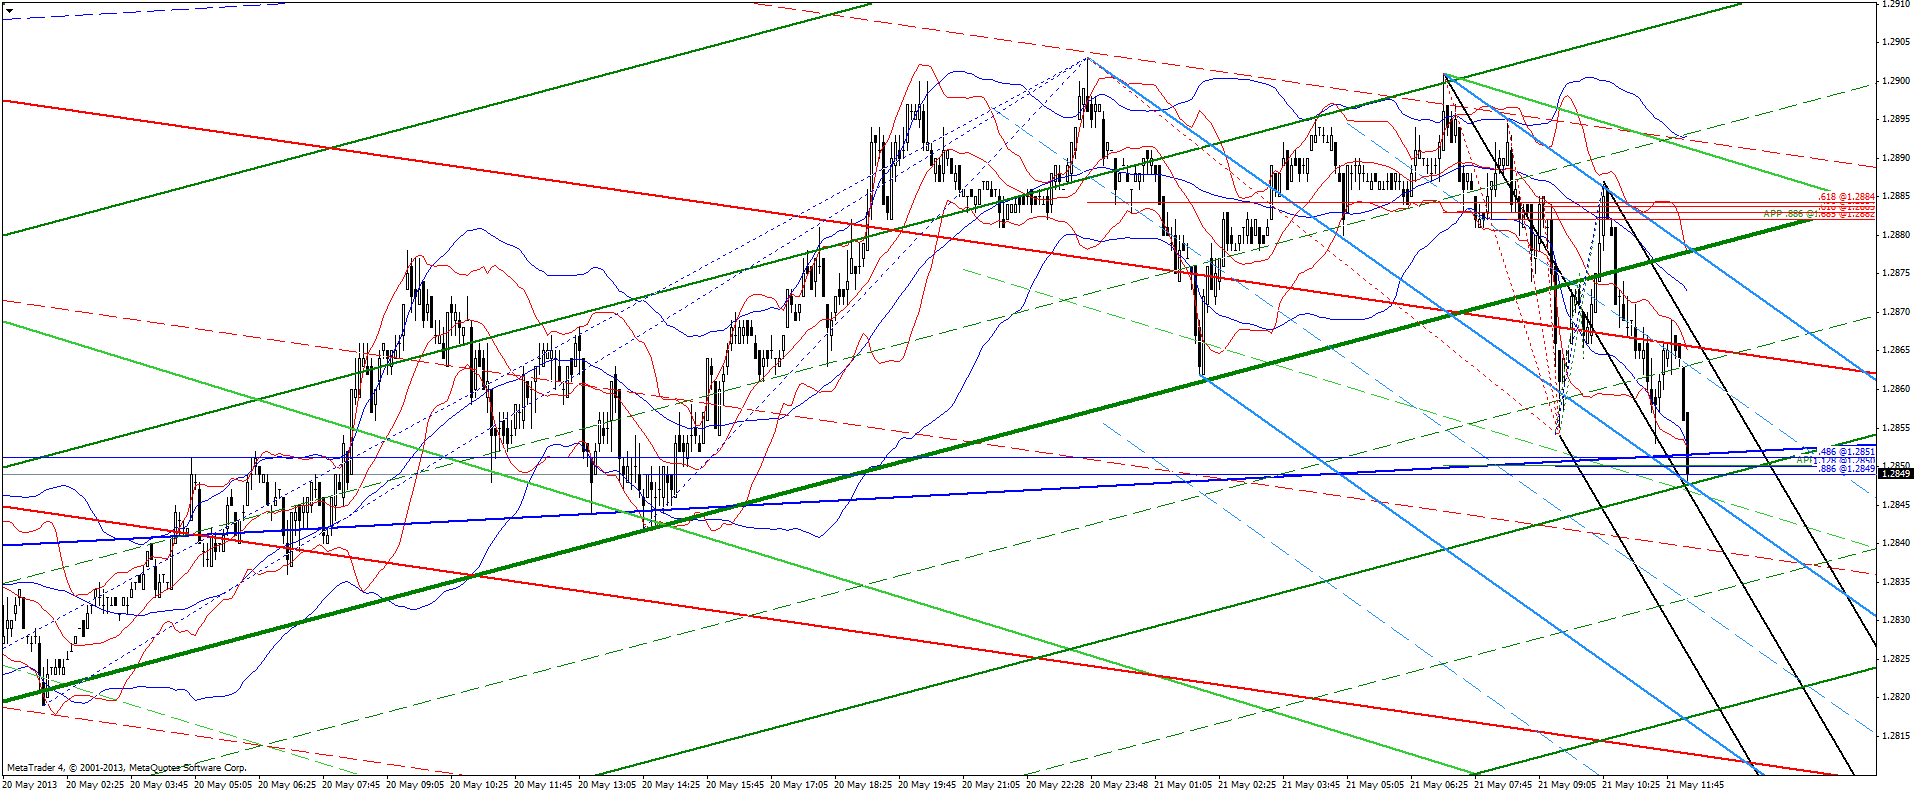
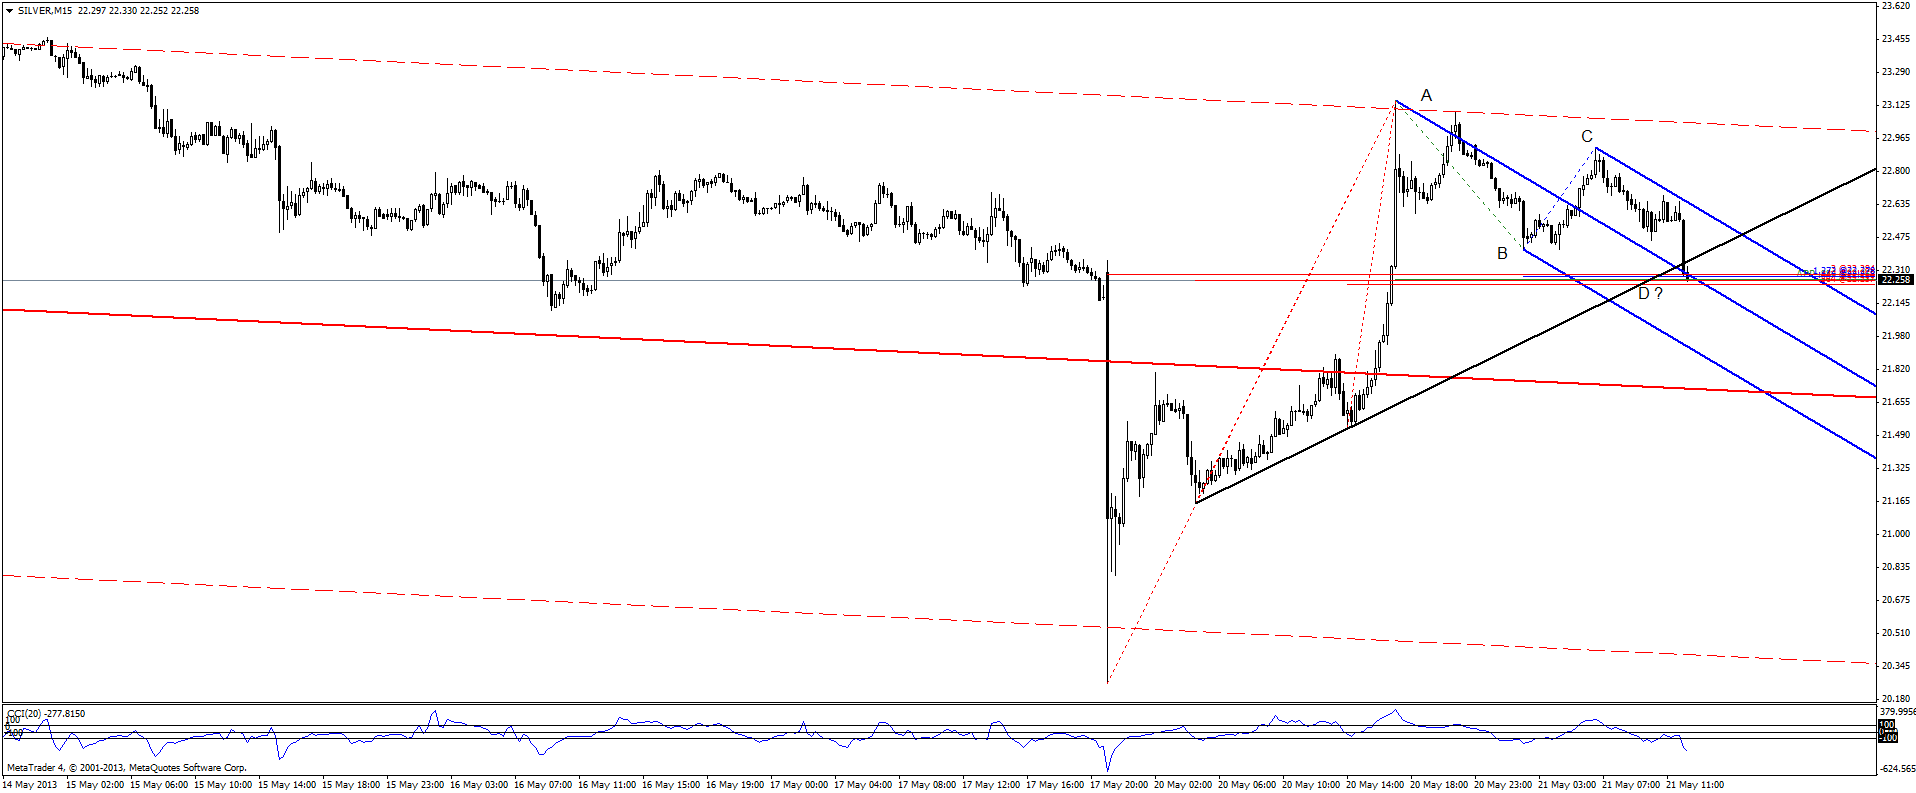
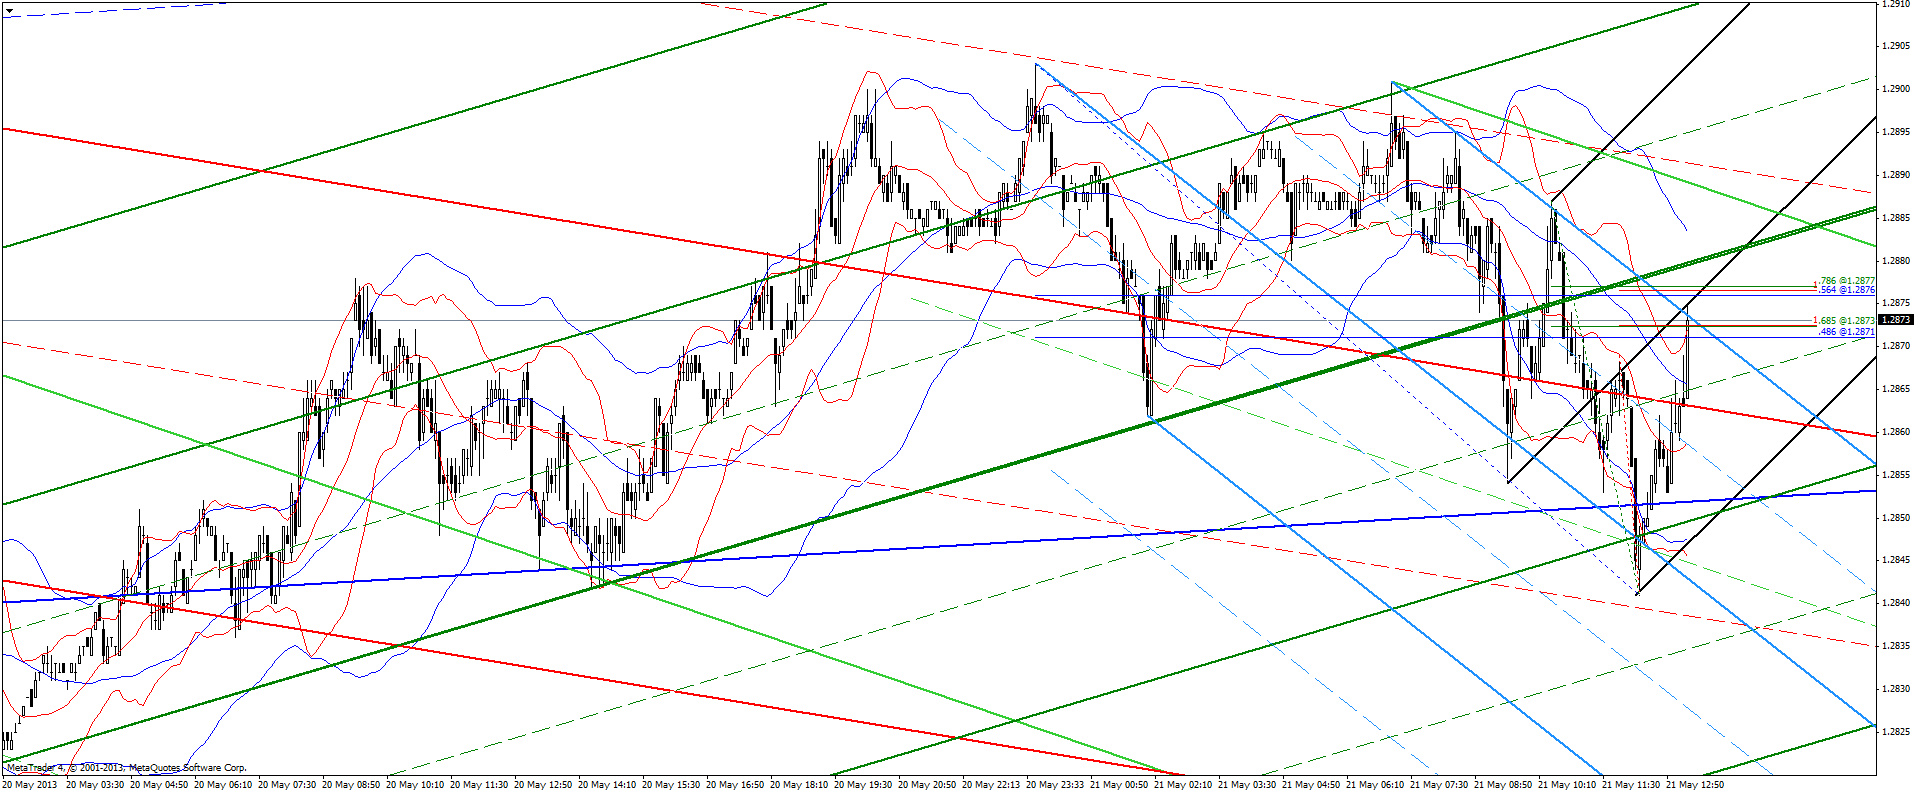
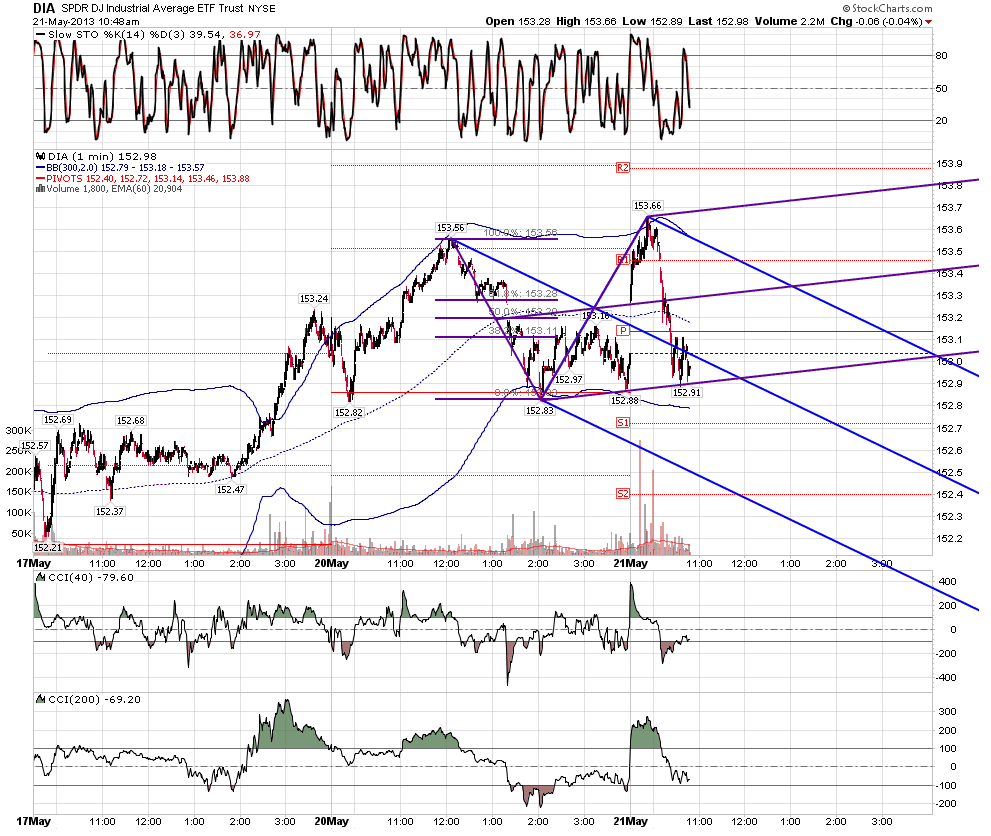
This area is being hit too late, but looks so nice.
Click image for original size
JI
jimkane
Rep: 3,058
Posts: 33,089
This chart isn't much different that the last one I posted, only it's a few points higher. It would be very technically shocking to me if this didn't draw any response. I do have another area in the very low 1700's, basis ES #F, and that would have this pushing its area hard to the upside, but still within reason. It does seem like they want that 2000 by year end.
Anyway, I'm seeing a lot of immediate calls for another 100 points on the ES, and so on. Everyone is a bull. If that target is hit, they'll up it another 100, if that is hit, another 100, until it ends. That's all they ever do. It's all they are capable of. I just want everyone to understand my opinion is that these people have little to no actual technical skills, they just play this game in every bull market (and they'll call the bottom all the way down in the next bear market, as that's what they do). We'll see.
Chart created on QCharts, courtesy eSignal
Anyway, I'm seeing a lot of immediate calls for another 100 points on the ES, and so on. Everyone is a bull. If that target is hit, they'll up it another 100, if that is hit, another 100, until it ends. That's all they ever do. It's all they are capable of. I just want everyone to understand my opinion is that these people have little to no actual technical skills, they just play this game in every bull market (and they'll call the bottom all the way down in the next bear market, as that's what they do). We'll see.
Click image for original size
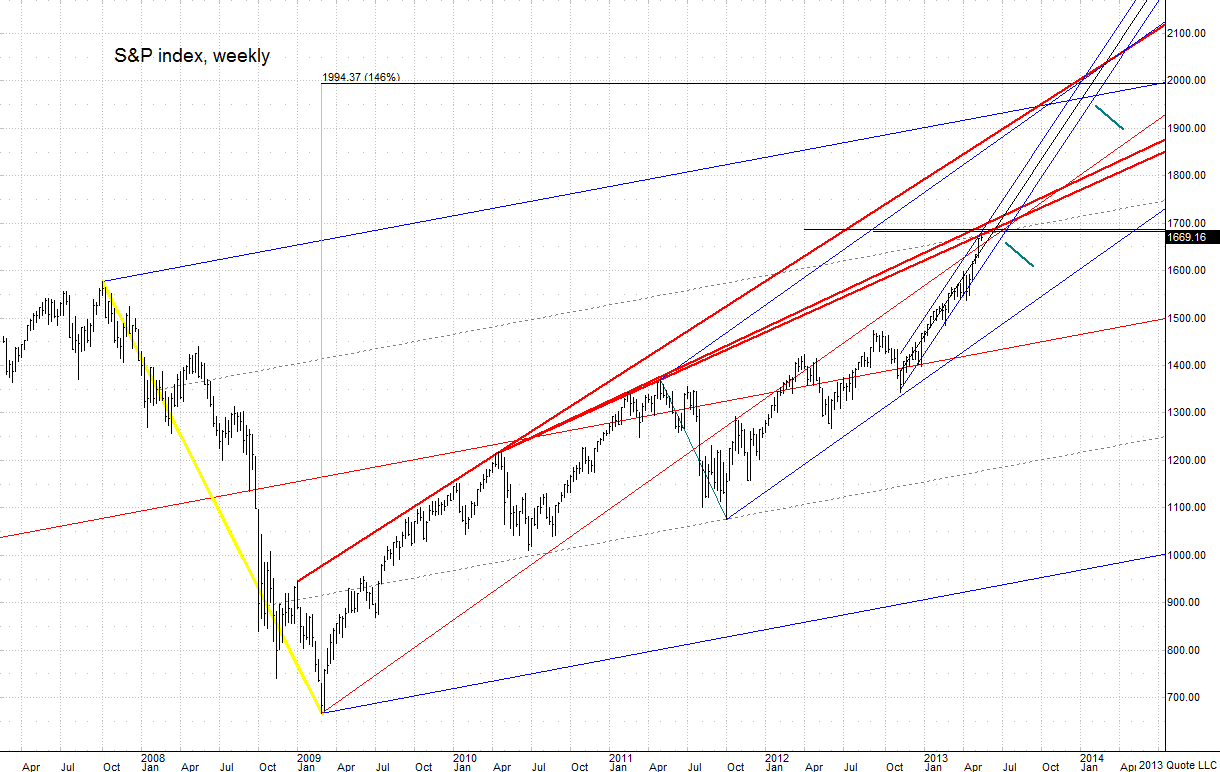
Chart created on QCharts, courtesy eSignal