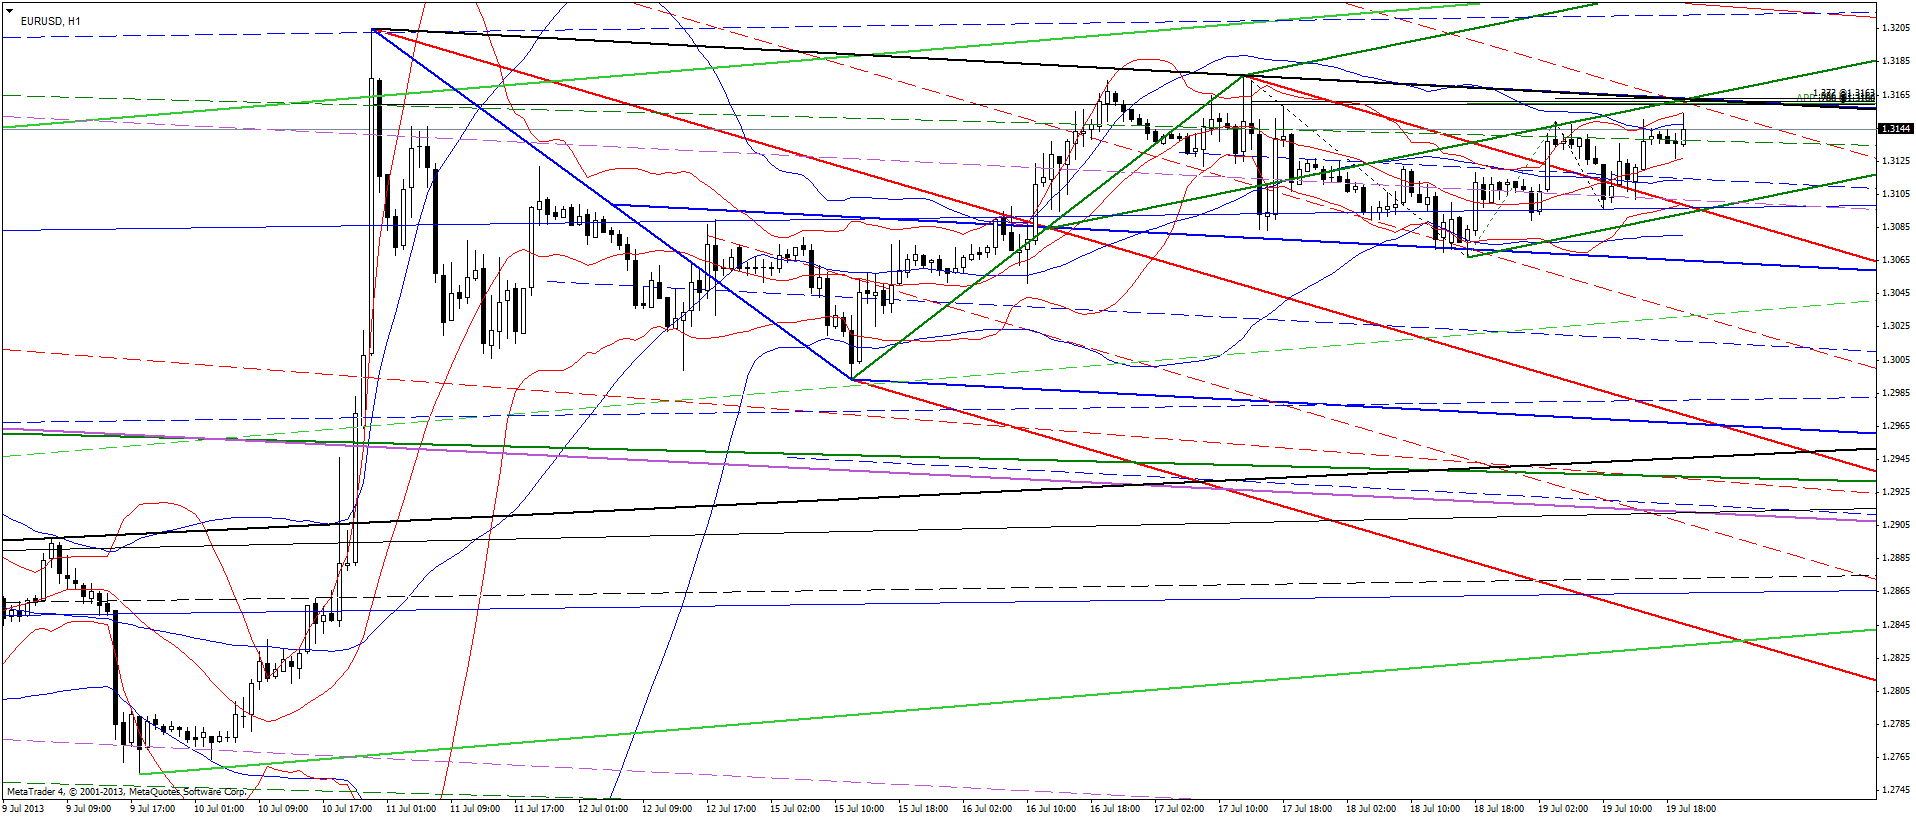
Okay, I'm going to post something here that is quite different than my usual. This is based on a new, proprietary timing idea I've been studying. It may amount to nothing at all. One thing about it that greatly bothers me is that almost everyone says end of this year, beginning of next the 'bull' ends. So does this technique. I don't like that. Maybe it ends then but after a very small pullback, the 'W1', everyone says it's over and then they all play the call the bottom game all the way down. That is one possible scenario.
The thing is, based on line and Fib work I see a major time factor in Jan. Now I come up with this totally different approach timing factor, and it implies the same thing. I want the 'bull' to be over now at this area so bad it's crazy, but it probably isn't. I will post this (and maybe even post it in a separate topic so I can find it easy (or maybe just link it here to the topic on links)), and we'll see. In case this does work, I want to get it on the record.
Here's what this tells me. The market rises to a new high somewhere between 10/10 and 11/6. It then drops down and starts its final rise, which hits between 1/6/14 and 1/23/14. That ends the 'bull', and it goes full bear market. None of this tells me any levels, I have to go back to my usual work for that. This is strictly a timing factor. Maybe it is nothing, but it looks extremely promising. Anyway, we'll see. All I can say is, if it rises until the first time period and then drops in a serious correction (which wouldn't exceed the recent lows, I would suspect), I'm going to really be wondering...
7/25/13 editor's note: I posted the first date series incorrectly, and just corrected it now, that range being 10/10-11/6. And no, that's not very precise, but it's about looking at approximate timing areas that may show the end of what I consider the craziest cyclical 'bull' market in the history of the world, so look at it that way.