ES Monday 9-16-13
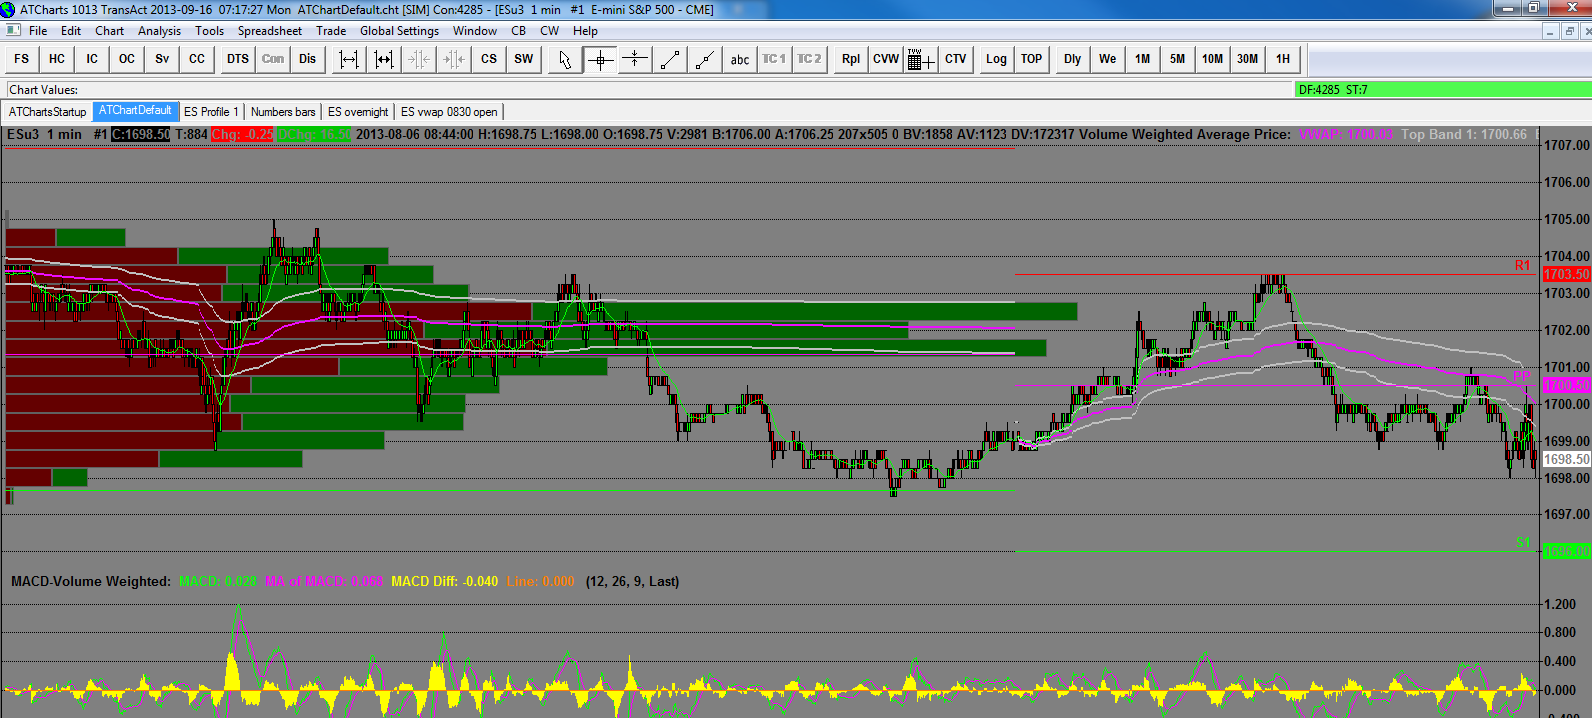
Big gap up over the weekend, back into record territory. The first chart is from August 5th and 6th, the last time we were at these levels. I didn't snap lines but you can see the high at 1705, the dip down to about 1697.50 and the retrace to 1703.50. After that the market started to fall off.
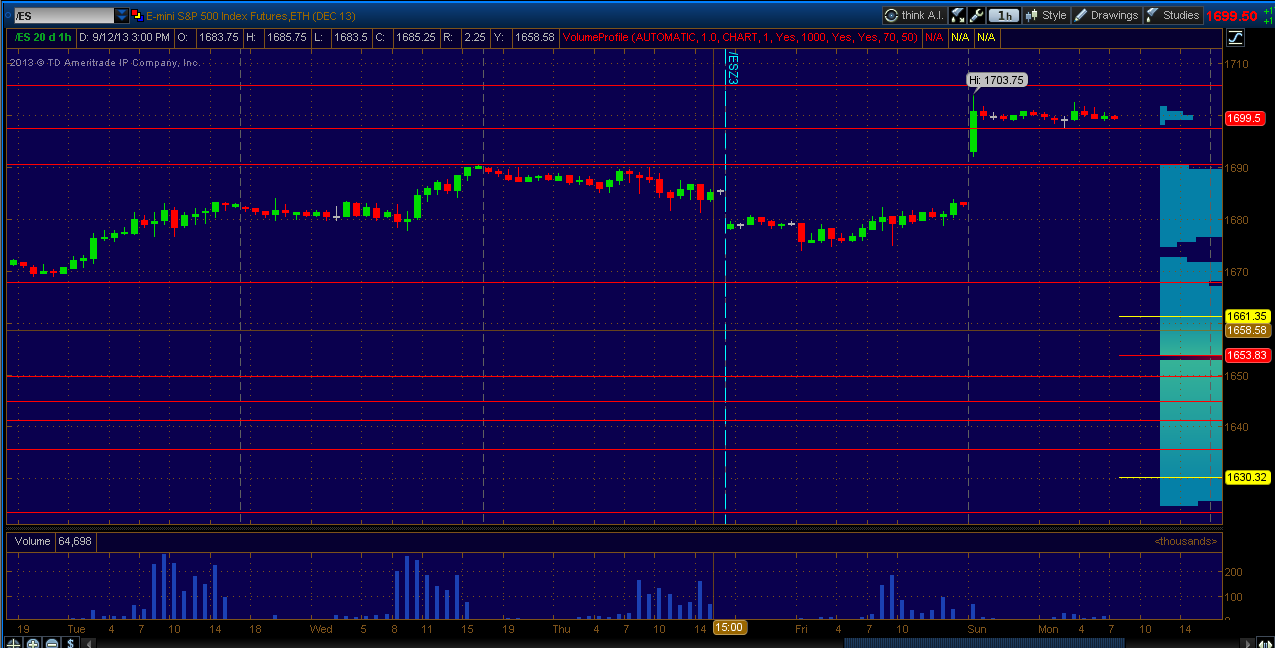
The second chart is current 60 minute. The lines only depict last weeks highs and the overnight support level which is also at 1697.50. Overnight markets are balanced and it's a long way back to fill the gap. Fed meetings this week to contend with also.
Click image for original size
The second chart is current 60 minute. The lines only depict last weeks highs and the overnight support level which is also at 1697.50. Overnight markets are balanced and it's a long way back to fill the gap. Fed meetings this week to contend with also.
Click image for original size
my numbers on the downside are
96 - 97
93-94
89.50 - 90.50
85 - 87
82.50 - 83
upside I only have the 1702.25 as a key area...sells above there ideally want to take something off at 99.50 and if lucky try for key zone and Overnight midpoint at 97...
will this be a sell the fact type of day ? I can't do anything until we see 1702 print or the 97
thanks Bkay for kicking us off today and your post
they want the midpoint
Thanks for the video Bruce. Yeah I just wanted to get things going, no real valuable info there. I would like to see a retrace into 97 to see if the sellers are there.
will try small buys at 93 - 94...concern is they will want an O/N low or high and we have opened and driven lower..so if stepping in front of the train go lightly...target will only be 95.50
i usually like when we start with all the volume at the open and then it shifts down...so we have a long drive and then somebody entered or exited at 95.50...so that will be first area for me if this is gonna work
oh nice...not much to manage from here but that 97 retest would be great.....gotta capture this
taking small stabs...that 95.50 needs to be the magnet off this lower zone
made a video and I think it shows the zones much better then first video babble.......
Thanks Bruce I really like those volume by price 30 minute charts. Gotta look into those..
OK, I did figure out how to set up that 30min volume profile chart.... So what Is the best way to use this?
I understand it is showing me where the most volume is at certain prices. It is my understanding from watching you that ...these levels are then areas to be aware of for support and resistance areas?
thanks if you can lead me to some of your videos that explains this more.
I understand it is showing me where the most volume is at certain prices. It is my understanding from watching you that ...these levels are then areas to be aware of for support and resistance areas?
thanks if you can lead me to some of your videos that explains this more.
Emini Day Trading /
Daily Notes /
Forecast /
Economic Events /
Search /
Terms and Conditions /
Disclaimer /
Books /
Online Books /
Site Map /
Contact /
Privacy Policy /
Links /
About /
Day Trading Forum /
Investment Calculators /
Pivot Point Calculator /
Market Profile Generator /
Fibonacci Calculator /
Mailing List /
Advertise Here /
Articles /
Financial Terms /
Brokers /
Software /
Holidays /
Stock Split Calendar /
Mortgage Calculator /
Donate
Copyright © 2004-2023, MyPivots. All rights reserved.
Copyright © 2004-2023, MyPivots. All rights reserved.