ES Wed 11-13-13
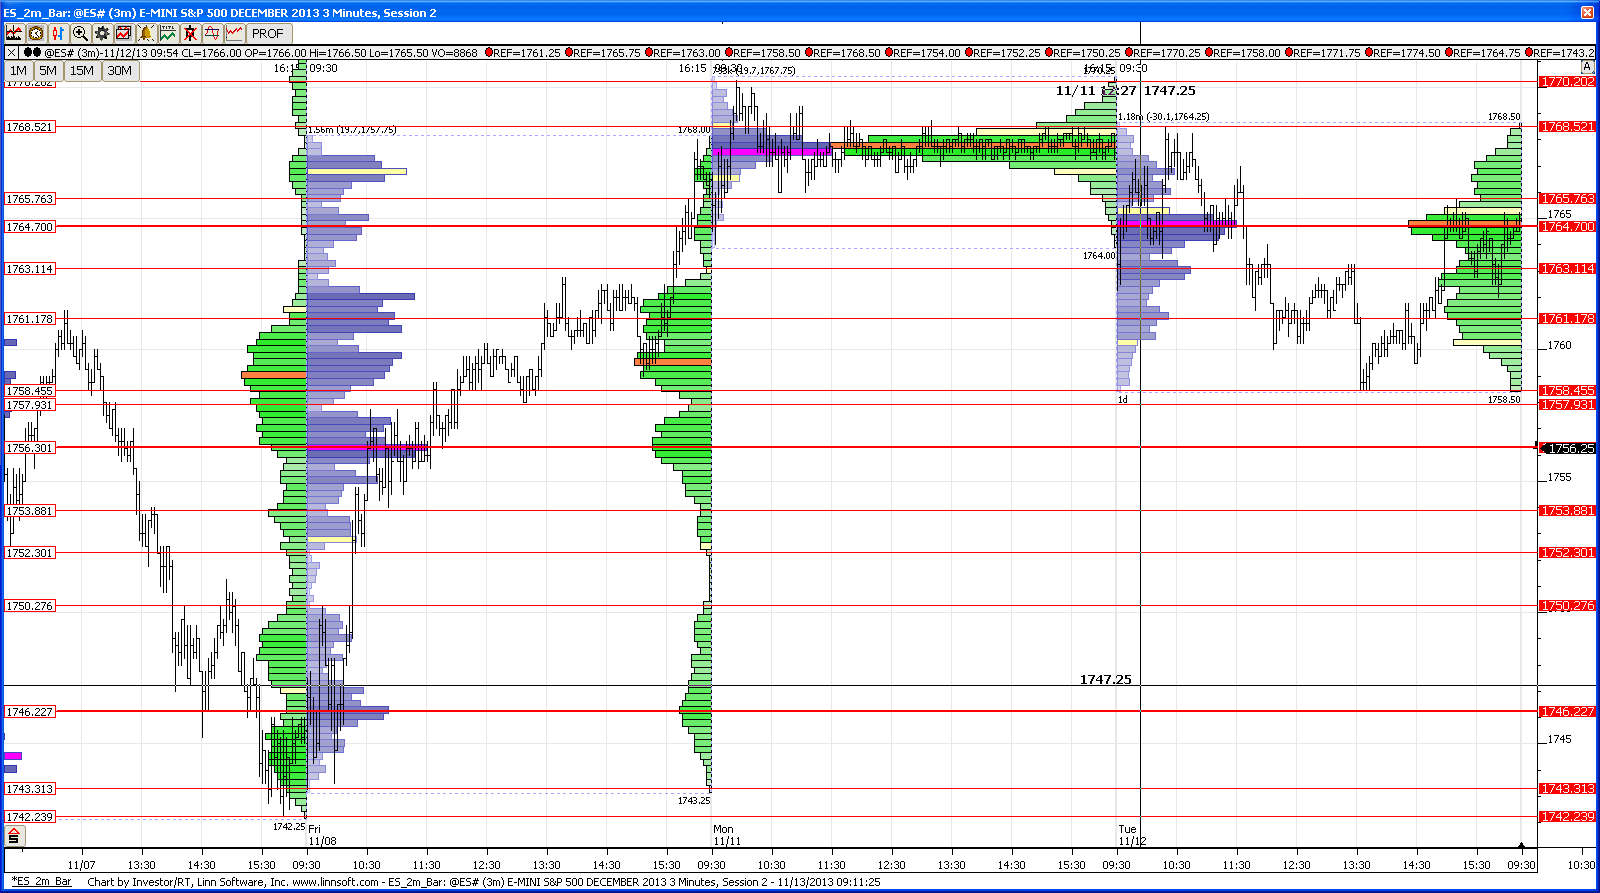
gm, from here i think that 50-52 area could still offer good risk reward for buyers, but will watch the internals to see if they are hinting at a trend day in which case i will not keep trying longs blindly especially if we dip below that 49-50 area...42-43 can offer a rebound as can the 36-37 area
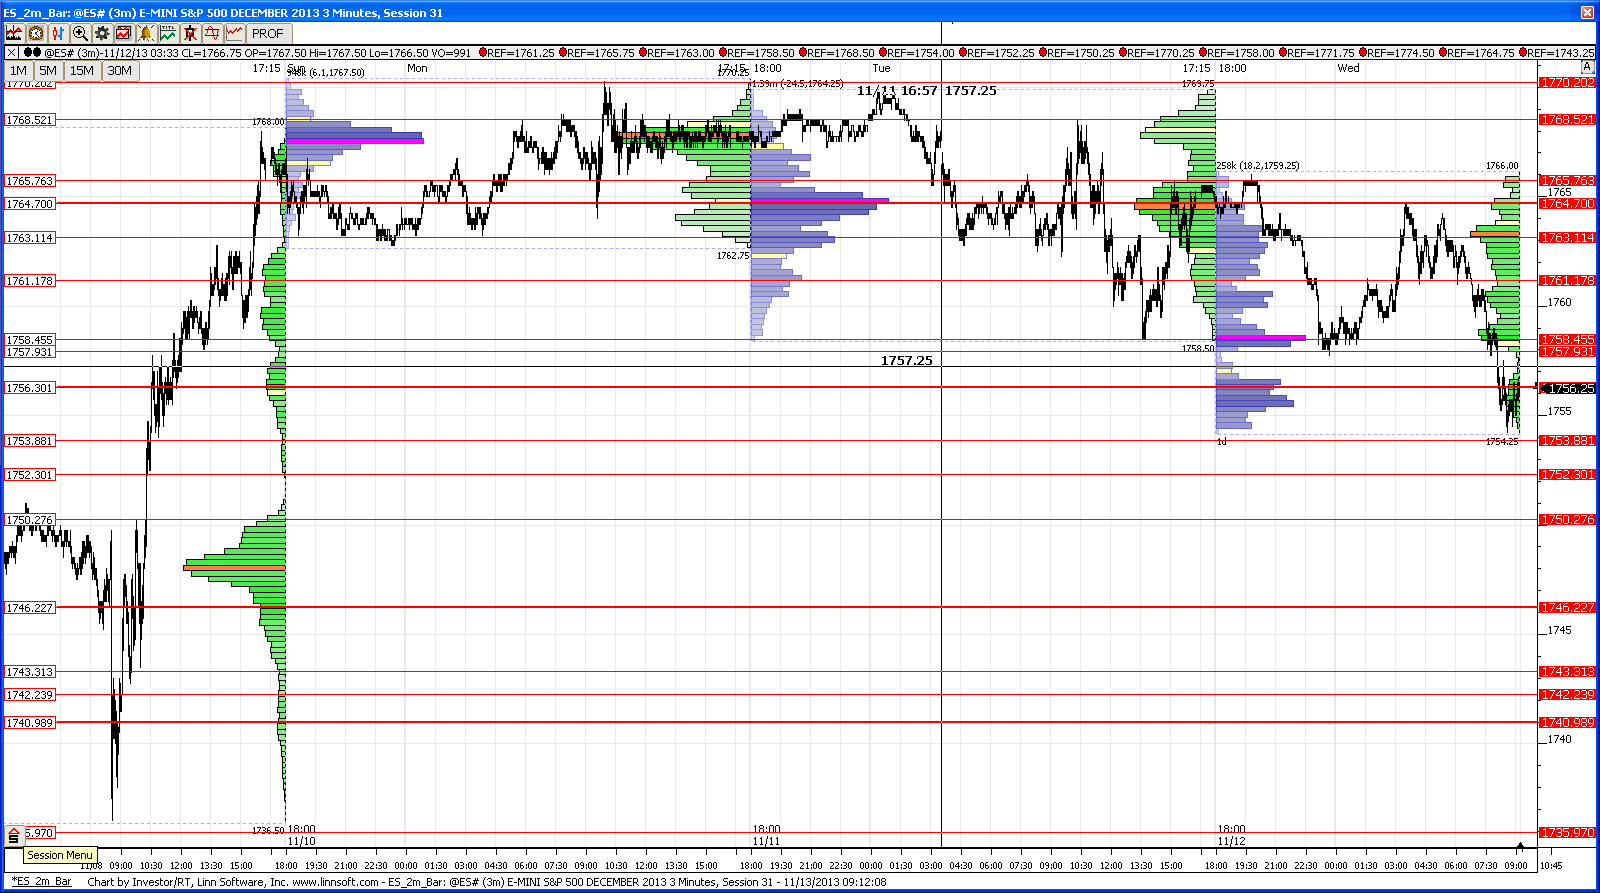
on the upside, 58-60 can offer some resis off the open (onvpoc at 58.5, o/n midpoint at 60)...above that 63-65 looks like the next spot to sell....61 is minor resist imo, even though i am showing it in the chart
good luck
on the upside, 58-60 can offer some resis off the open (onvpoc at 58.5, o/n midpoint at 60)...above that 63-65 looks like the next spot to sell....61 is minor resist imo, even though i am showing it in the chart
good luck
Click image for original size
Click image for original size
Short at 60.00
Click image for original size
half off at 58.75
60.25 entry for me pt, with your same scale and then the rest was off at -1 tick on the way back up...looking strong, internals straight up since the open albeit negative
Click image for original size
that 63-65 area was decent resis as expected earlier today...i was offering 63 so was left behind on that one...still glad to see it working...bears need to deal with 58.5 now from above and the dev vwap and mid at59.25-59.5, so bulls can definetely take the ball from here and aim to fil the gap (65)...we'll see
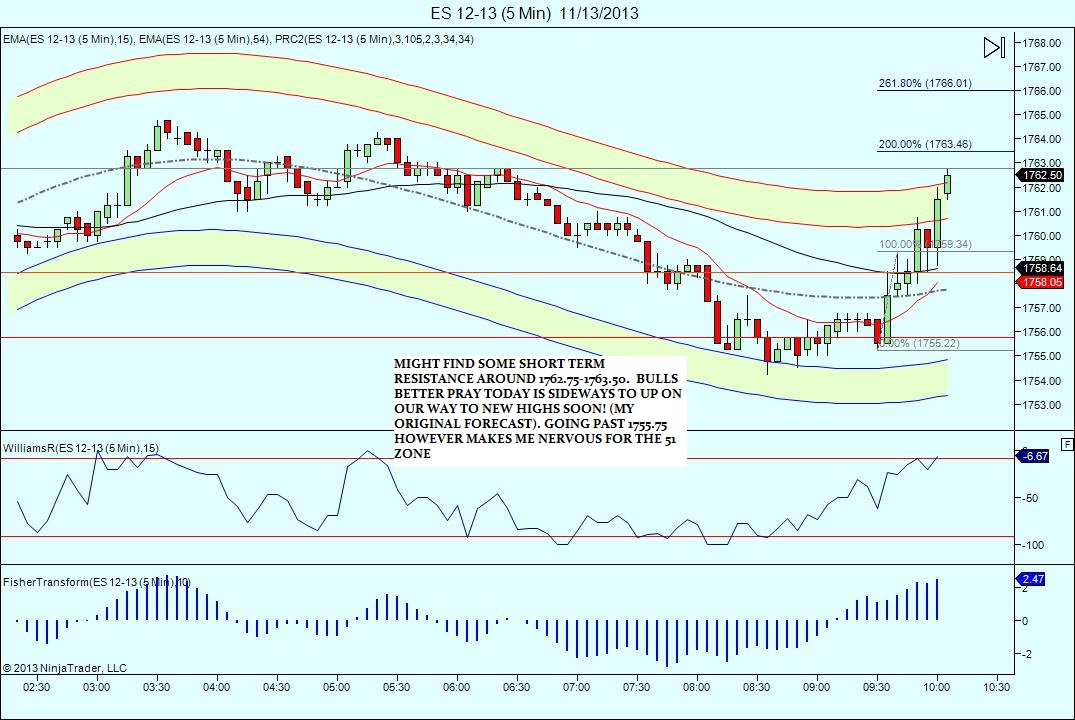
went short at 1763.00 but a tight stop and quick exit ,i hope....
well, if we did make an important bottom at 54, it certainly is bullish behavior so far...at least on my charts...soon the 10 chart avgs will cross bullish unless we spend time below59 and i tend to think we may see 66 ...
This market is acting as if a short term bottom is in (seasonal influence?) . Anyway , i will cover break even here, if they let me. Otherwise, 1765.00 stops me out.
whew!.. wimped out at breakeven... watching. (heck, im supposed to be showing preference for buying today anyway)..lol by the way, my 10 min chart just went positive
sorry, it should be 1788!
Emini Day Trading /
Daily Notes /
Forecast /
Economic Events /
Search /
Terms and Conditions /
Disclaimer /
Books /
Online Books /
Site Map /
Contact /
Privacy Policy /
Links /
About /
Day Trading Forum /
Investment Calculators /
Pivot Point Calculator /
Market Profile Generator /
Fibonacci Calculator /
Mailing List /
Advertise Here /
Articles /
Financial Terms /
Brokers /
Software /
Holidays /
Stock Split Calendar /
Mortgage Calculator /
Donate
Copyright © 2004-2023, MyPivots. All rights reserved.
Copyright © 2004-2023, MyPivots. All rights reserved.