ES 7-7-14
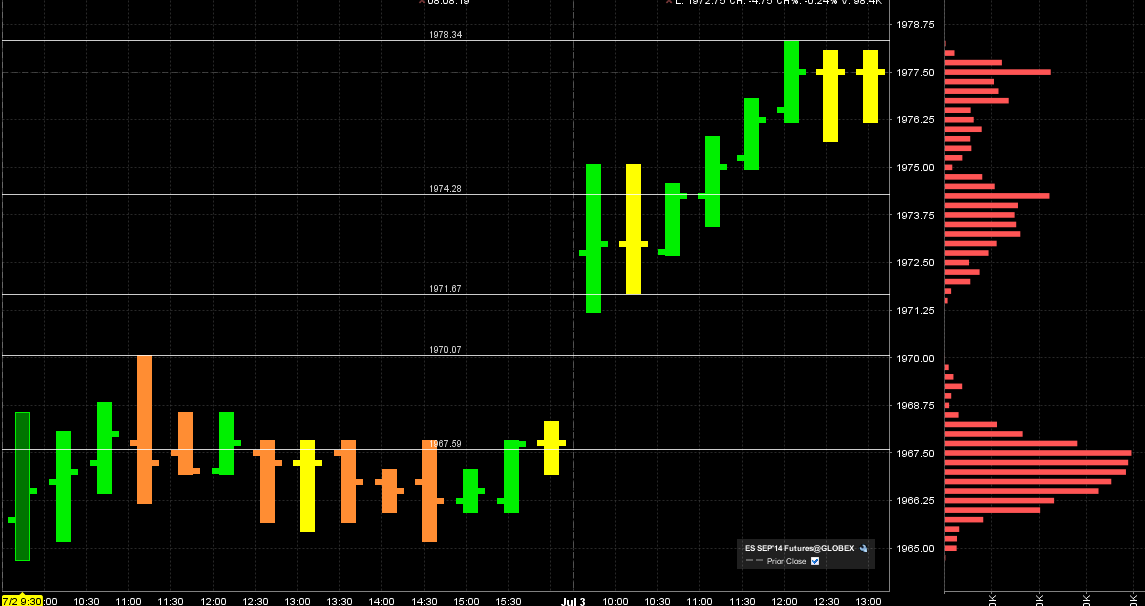
I usually expect what happens on the last trading day of one week to spill over into the next week...at least the first day of the next week....as I type we are hitting into an LVN between Thursdays lows and Wednesdays highs so that is really the first buy point at 1970 - 1971.50....today we have an S1 at 73.25 and a POc from Thursday at 74.50 so that needs to be watched and used as a magnet....opening under and staying under there is bad for our bullish bias in general today...
a failure on the long this morning will try to drive back to the 67 - 68.50 area which has volume and time but also an S2 area today
here is a rough chart with the levels I am watching...only looking to try one or two longs......I am usually more skeptical when we opne under both an S1 and a POC from the prior day
Click image for original size
OK,
thanks Bruce.
thanks Bruce.
I believe there is no edge inside this IB...best to just wait it out if u play from here....I'm not trading anymore but we all know that we can't get above Thursdays POC and the strength from that day is NOT carrying over so far today.......I'd be thinking about what happens at an IB high or low break and what that impies as to who will win....so I'd be aslking myself this:
1) does the break of the IB high imply that the strength I expected IS still coming and we will get the gap close and last weeks highs ?
or
2) Does the break from the IB lows imply that the strength isn't showing up and we get a better sell off...
these may seem like basic questions but they would keep me from fading the IB high or low today........years ago I'd fade anything that had a spikey chart point to it ....LOL !! Hope all do well from here
is there anyone here that looks at cumulative delta
Paul I watch Cumulative Delta. I use it primarily to confirm strength/weakness, or as a divergence tool. For instance this move down shows pretty good momentum on CD.
My Delta chart of recent price action this morning. See trapped longs at top of move, in my opinion.
Click image for original size
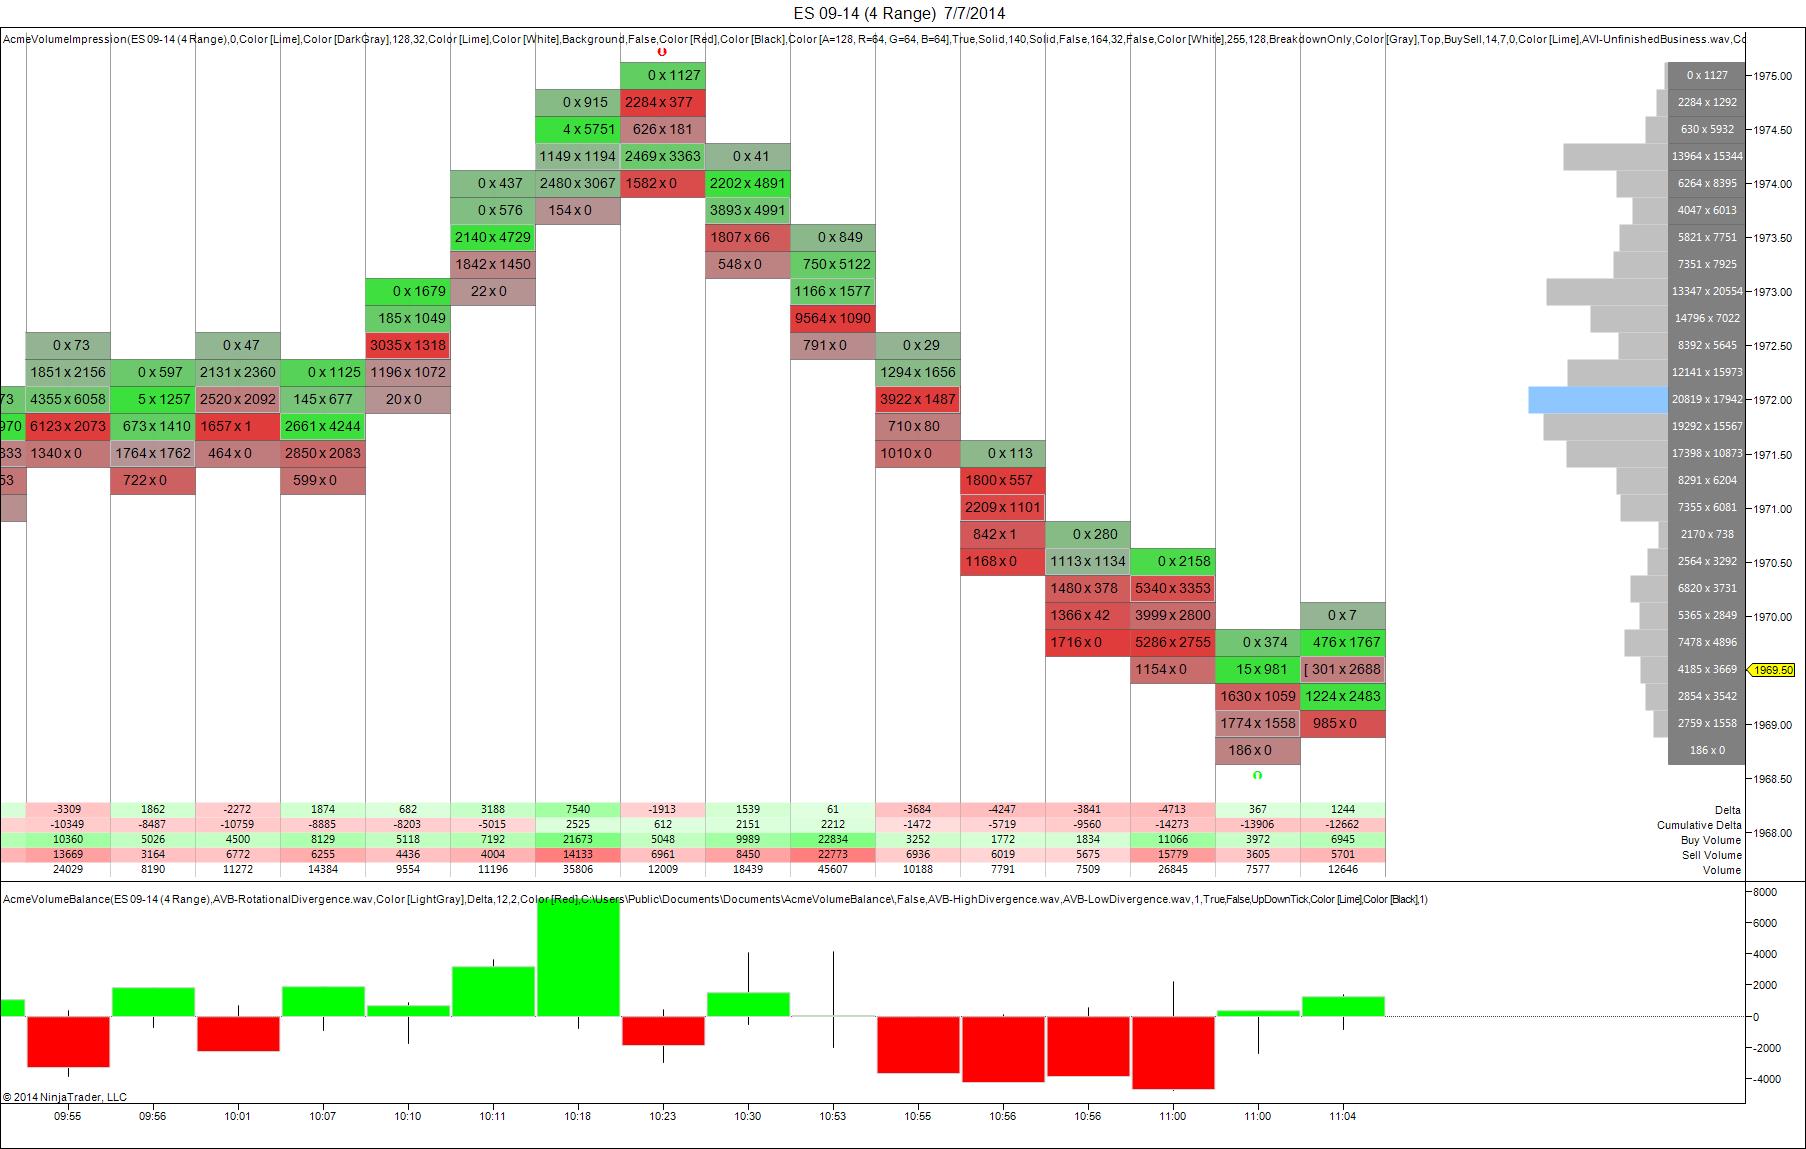
that's a nice chart Sharks...one can see the higher price but a delta that is lower at highs and negative delta .....the same way one can see the lower price with positive delta on the current lows shown on your chart...for fun I am wathcing to see if they can keep the closes above the Ib break down point and that LVN area which would imply that the Ib break is a fake out...not trading now..just babbling!!
Sharks, I am assuming in your chart, you are using "Impression, Evaluation Strategy" setup as "UpDownTick", which shows 0x1127 at the high. I use "BidAsk" instead, which shows 123x1004 at the high; this means, there could be a potential stab at the high once again sometime today.
You are correct Stocksster on the "UpDownTick" setting....
Emini Day Trading /
Daily Notes /
Forecast /
Economic Events /
Search /
Terms and Conditions /
Disclaimer /
Books /
Online Books /
Site Map /
Contact /
Privacy Policy /
Links /
About /
Day Trading Forum /
Investment Calculators /
Pivot Point Calculator /
Market Profile Generator /
Fibonacci Calculator /
Mailing List /
Advertise Here /
Articles /
Financial Terms /
Brokers /
Software /
Holidays /
Stock Split Calendar /
Mortgage Calculator /
Donate
Copyright © 2004-2023, MyPivots. All rights reserved.
Copyright © 2004-2023, MyPivots. All rights reserved.