MyPivots
Sign In
MA
MarcinO
Rep: 67
Posts: 5,506
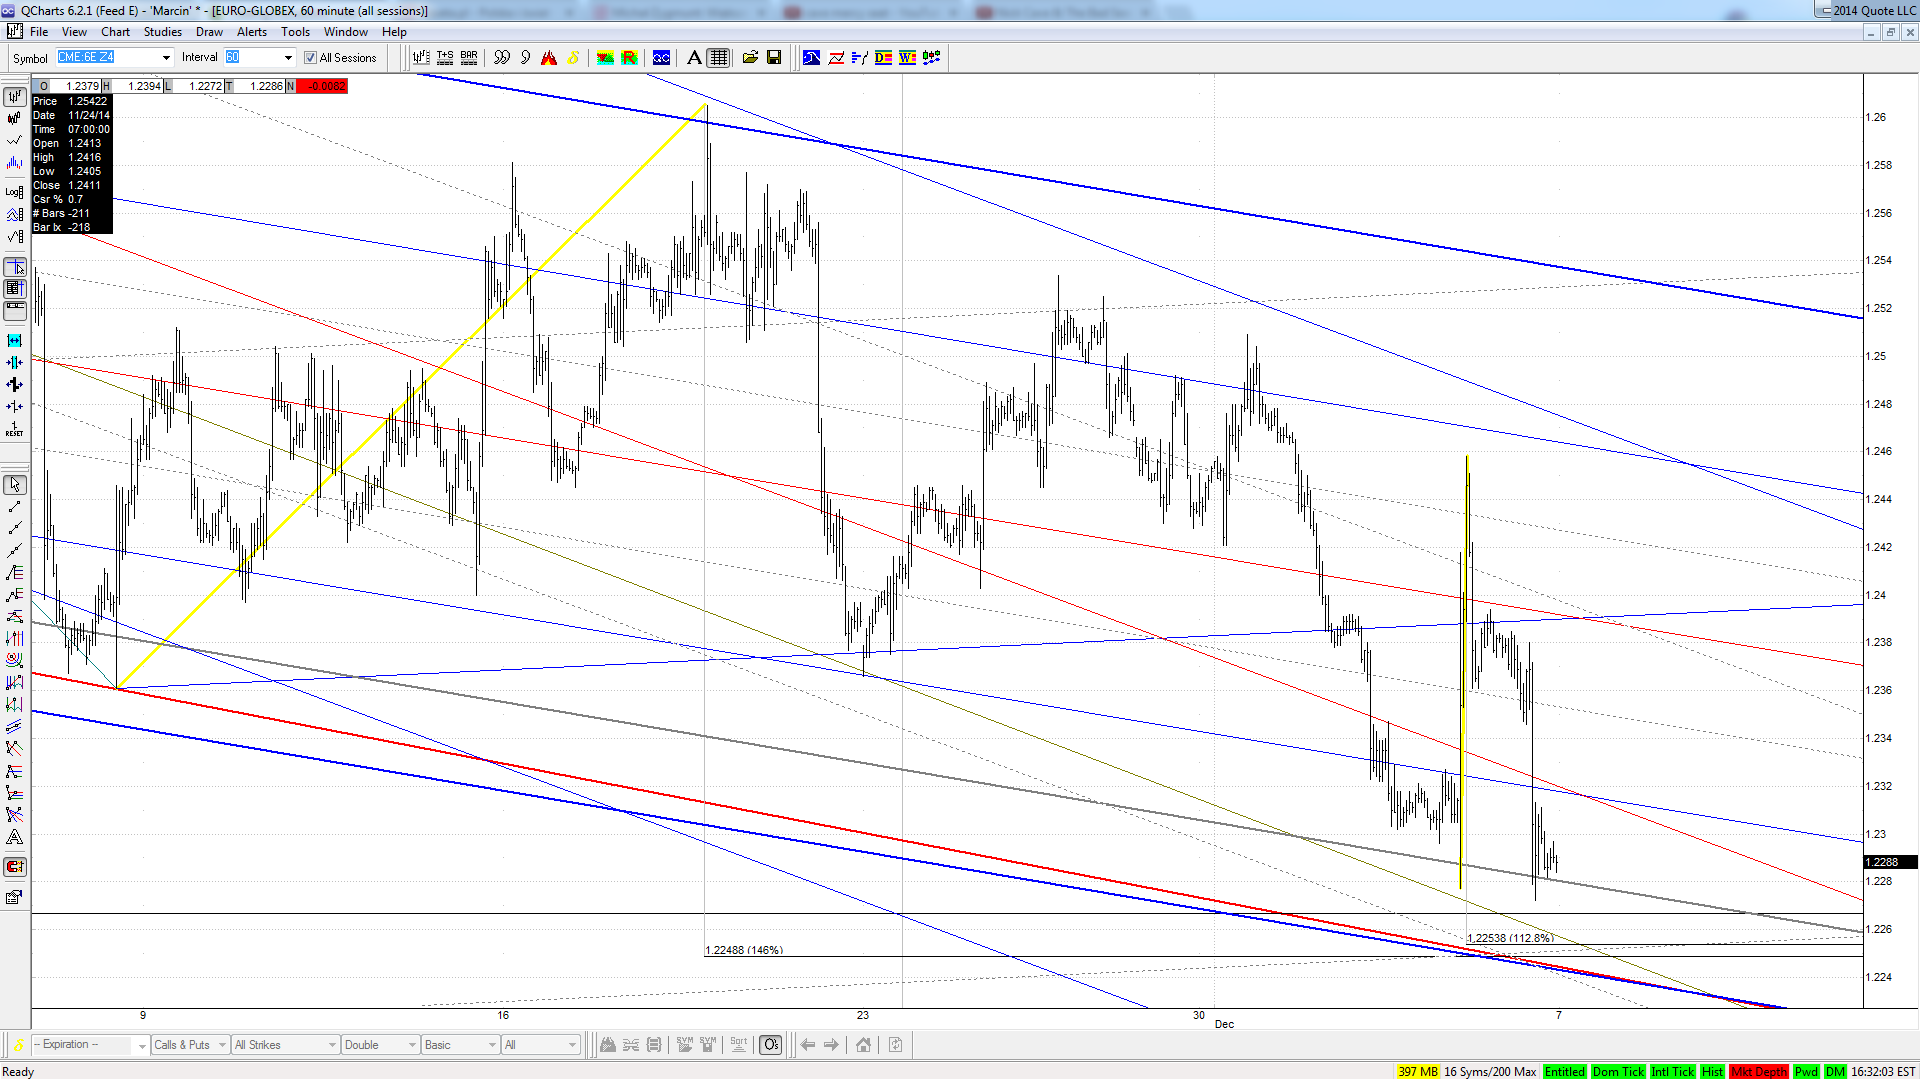
The Euro made it to a serious support area. The heart of it is around 1.2250 so a deeper move into it might still be in play.

Click image for original size
6e 2014 12 07 png


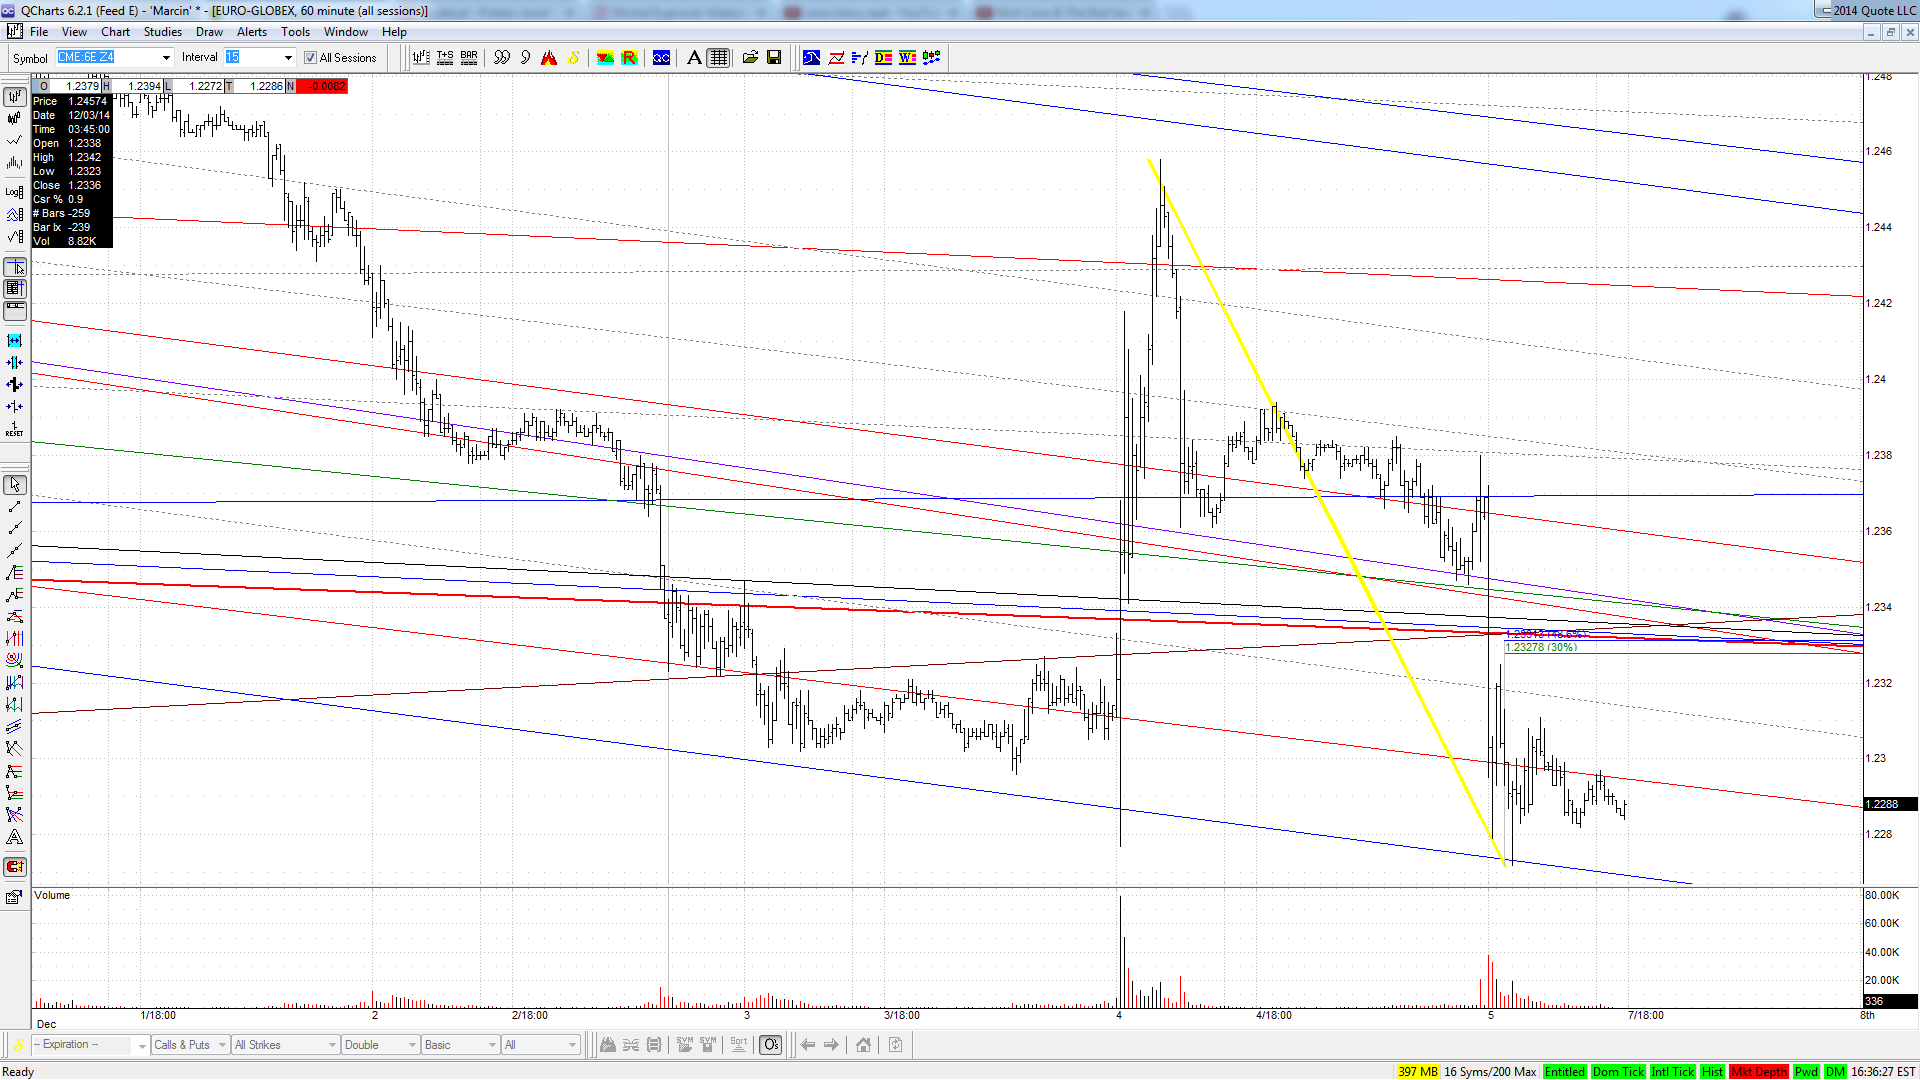
The curious thing about this layout is that it doesn't really matter if we get one, ore more, push to the downside, geometry indicates 1.2330 region as a serious correction level. What's even more interesting, if someone wants to play aorund with Fibs and MLs and adjust it now at 1.2250 (although it has not been hit yet), they will give additional confirmation of the 30s importance.

Click image for original size
6e 2014 12 07 2 png
JI
jimkane
Rep: 3,058
Posts: 33,089
The 1.272 at 59.50 draws the reaction? Really?

Originally posted by jimkane

61 coming...

Originally posted by jimkane

The next area is around 61, but if it takes out this high it blows out a major area, and 61 is just local stuff.

JI
jimkane
Rep: 3,058
Posts: 33,089
Okay, let's come in here and get it to that 61 now.
MA
MarcinO
Rep: 67
Posts: 5,506
My understanding of the situation in Euro is as follows.
It touched obvious TL visible on daily/weekly TF in a 3D fashion. The best way to suck more people in is to violate mid-term TL (let's say H2 TF) based on 3Ds. This is a plan minimum I guess and we may also expect much more than mere TL fakeout.

Click image for original size
6e 2014 12 09 png

That's why I think that bearish correction to the KZ is done.

Click image for original size
6e 2014 12 09 2 png
MA
MarcinO
Rep: 67
Posts: 5,506
At least this is what they do with ES from time to time on its constant way up.
JI
jimkane
Rep: 3,058
Posts: 33,089
Nice stuff, Marcin.
JI
jimkane
Rep: 3,058
Posts: 33,089
60.50. Will it do another push to hit 61 fully, or is that close enough? Bottom line, it did exactly what I expected once it decided pushing it up was the choice.
JI
jimkane
Rep: 3,058
Posts: 33,089
Gimme another little push.
JI
jimkane
Rep: 3,058
Posts: 33,089
60.75 on that additional push, and then they dump it. Okay, within one tick, that's not bad. Actually, 61 was just 'center of area', as everything is an area, not a precise to the tick point, of course. But it's fun when it hits right at the center and I can play around about how close I get. Yawn, ho-hum. With the tools and experience I have, it's pretty basic stuff most of the time. No claims, just my opinion, which I kinda sorta demonstrate in here pretty much every day.
MA
MarcinO
Rep: 67
Posts: 5,506
If my scenario for Euro plays out, I will place respective charts for my next levels (actually ranges around them): 1.2510, 1.2550, 1. 2605.
JI
jimkane
Rep: 3,058
Posts: 33,089
My next weekly/monthly key area for crude is 57-60. Something might happen in there.
JI
jimkane
Rep: 3,058
Posts: 33,089
Crude has a super-key TL around 47, and I'd think they'd want to screw with that. Then the key area is around the previous low, 33-36 and change. If crude gets into the 30's I plan to 'go all in' in every way, shape, and form I can on crude. Whether I will have the nerve when the time comes to break the rules and put a goodly portion of my eggs in one basket will remain to be seen. Many will be looking for a repeat of the last time it hit that level, and that worries me tremendously. But, crude staying in the 30's for any period of time? That could only happen if we are in complete collapse mode, and that would have to include China, who would be willing to buy the entire world's supply almost indefinitely at that price. it's all very 'odd'.

Bottom line, crude is at a monster area right now. The 47 TL area is obvious. And the 33-36+ area is known to every person on earth, even the handful of people in indigenous tribes who have never had outside contact. Even they are talking about that level. So, all I can say is, this is ripe for insane levels of games. It's going to be a lot of fun, let me tell you that!