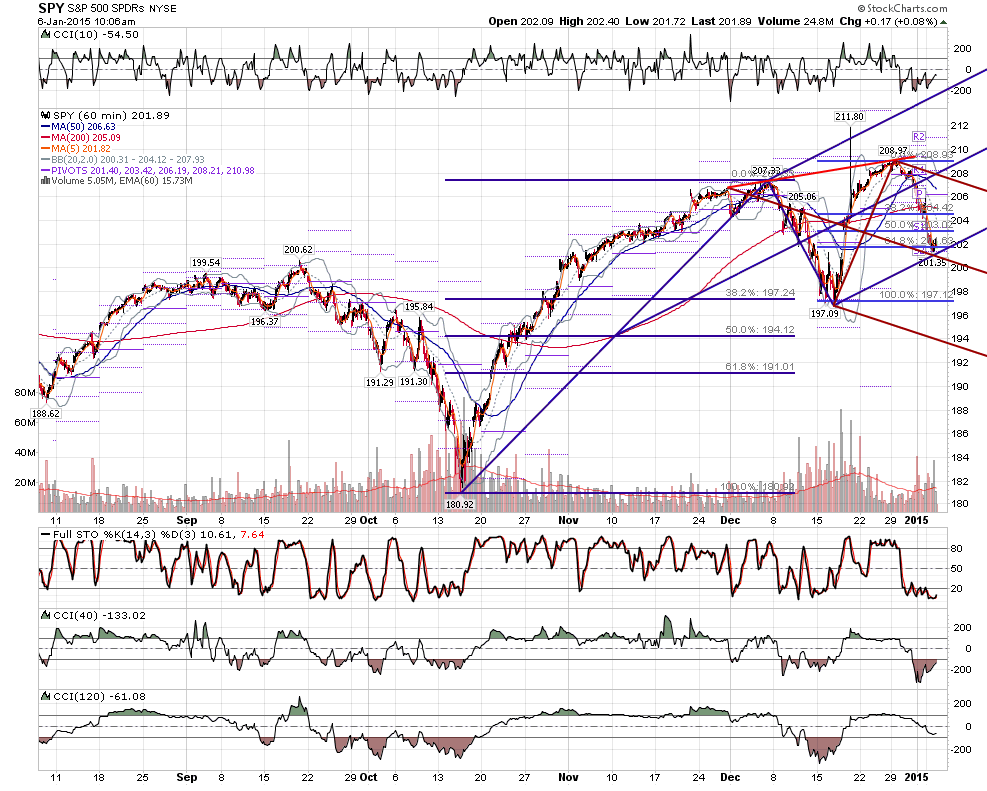
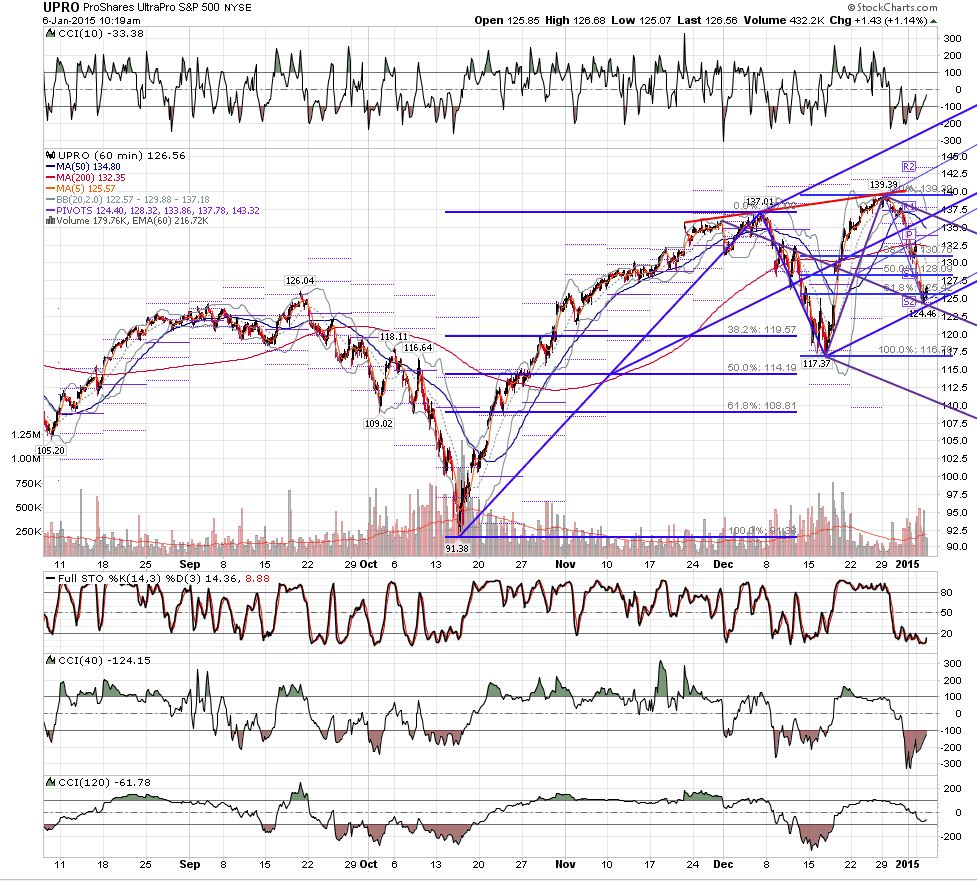
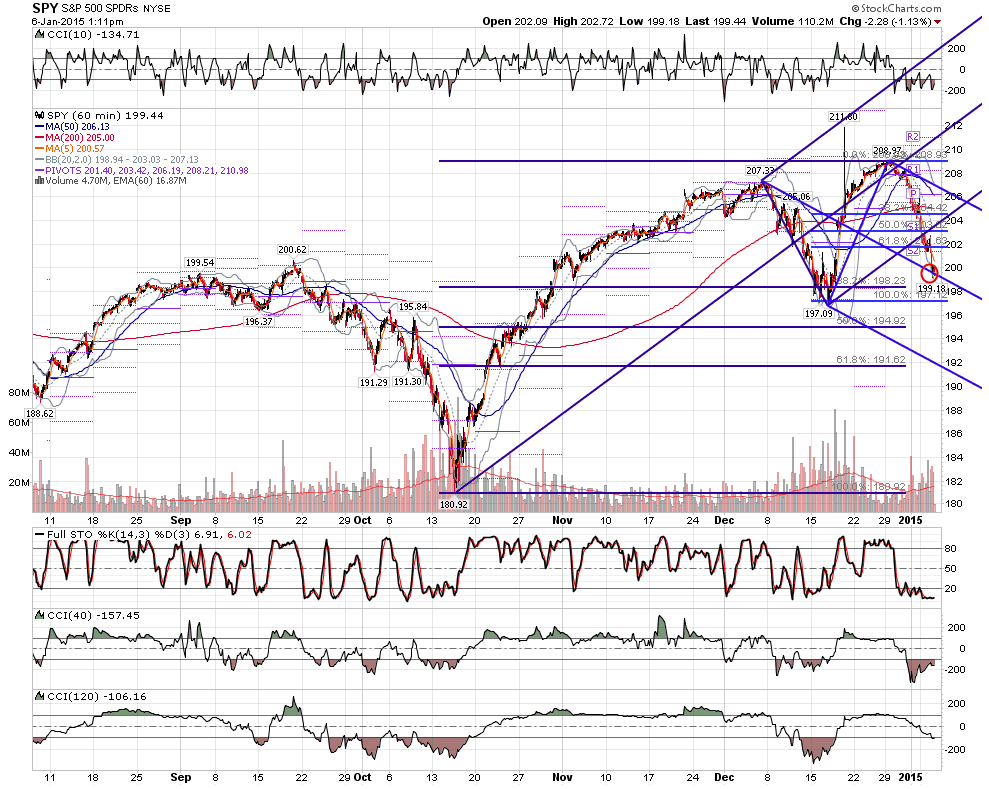
I'll start it off.
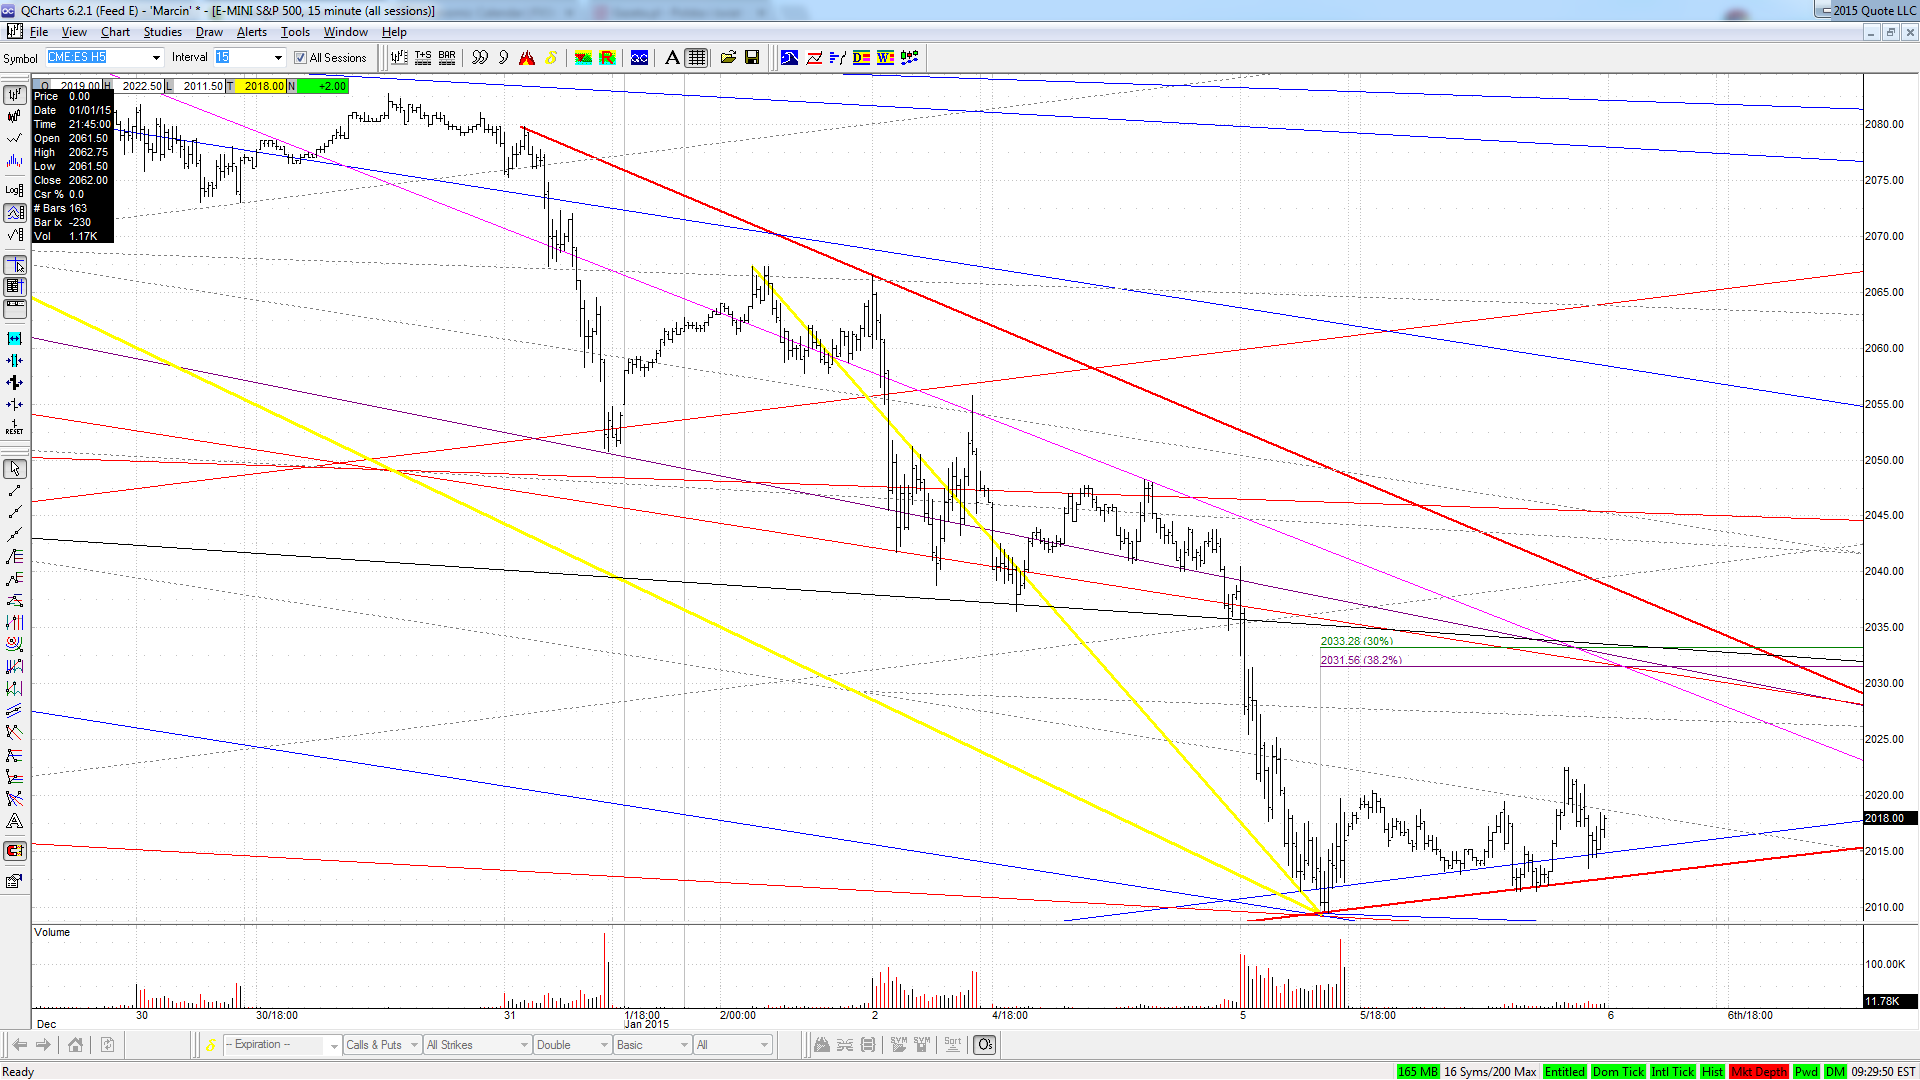
My opinion is that 31-35 level for thes ES, posted on the 1st Jan., is even more worth attention given the structure of the correction, especially potential 3Ds into this area.
JI
jimkane
Rep: 3,058
Posts: 33,089
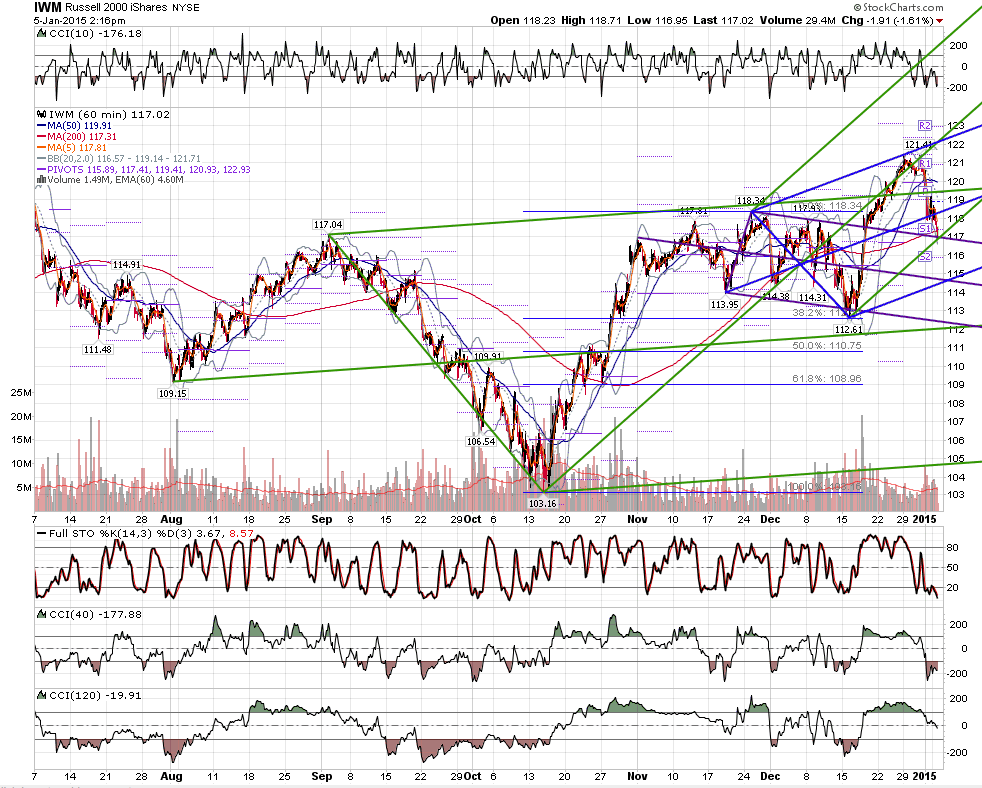
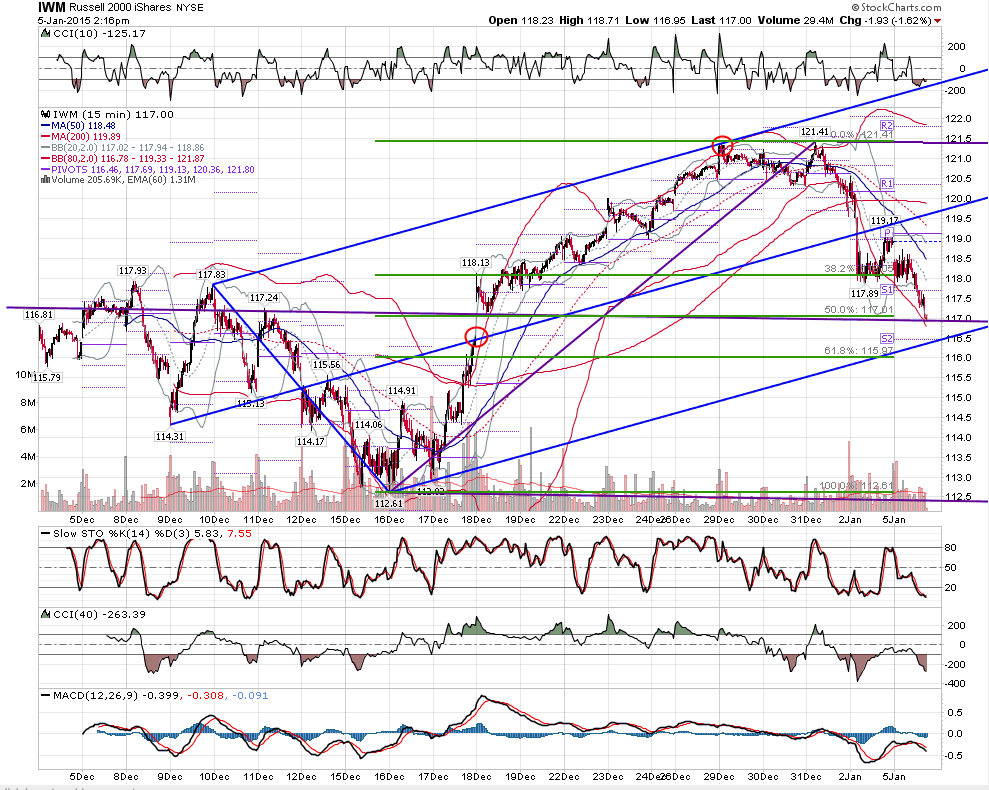
I have wanted to post this since it hit the spot and rat was posting UPRO charts, but, as you can see by my super-low activity levels in the forum lately, I never got to it. Anyway, this is why I was really 'worried' at the recent high there when many were very bullish. I never underestimate the power of a good spike line on the proper layout.
Chart created on QCharts, courtesy eSignal
Click image for original size
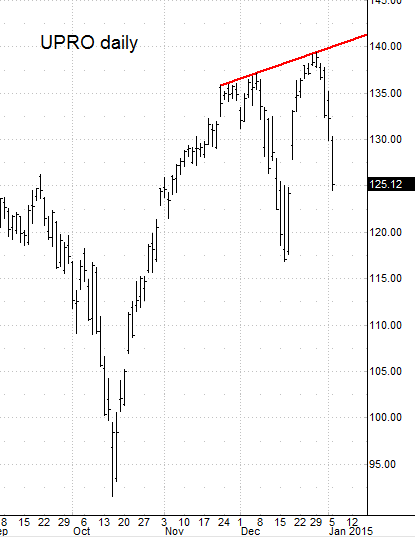
Chart created on QCharts, courtesy eSignal
JI
jimkane
Rep: 3,058
Posts: 33,089
Looks like the first target is 105 to me.
Originally posted by rat89
target basically hit
Click image for original size
Click image for original size
RA
rat89
Rep: 0
Posts: 7,015
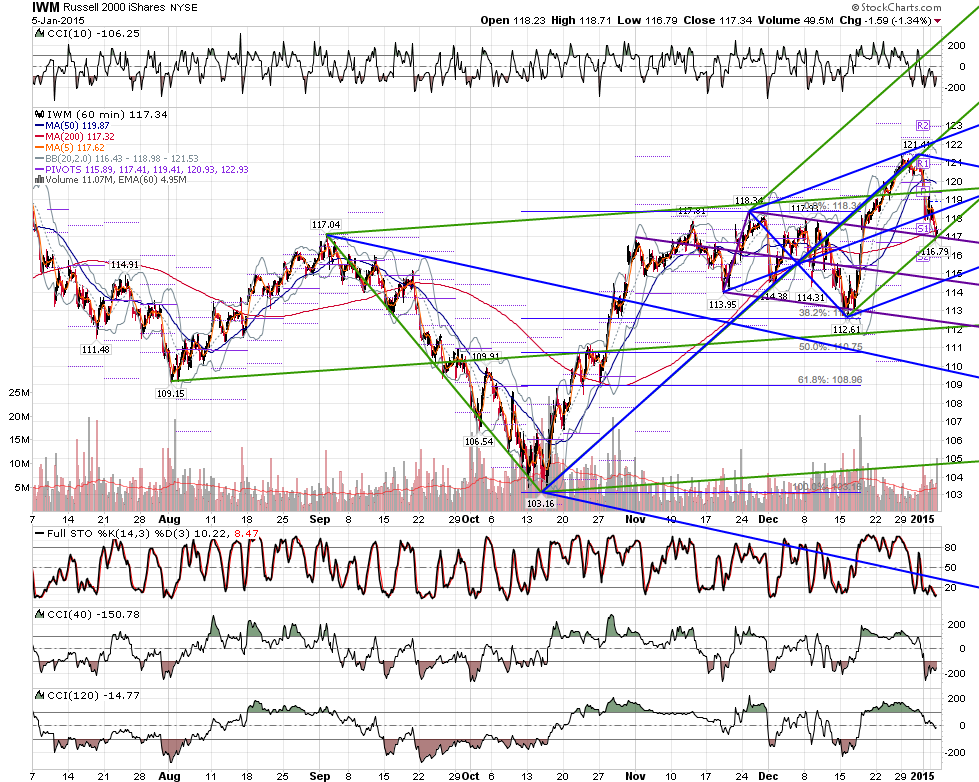
if this area were taken out with force, then 110 area for me.....my overall feeling is that this is a bear trap however ;)
Click image for original size
JI
jimkane
Rep: 3,058
Posts: 33,089
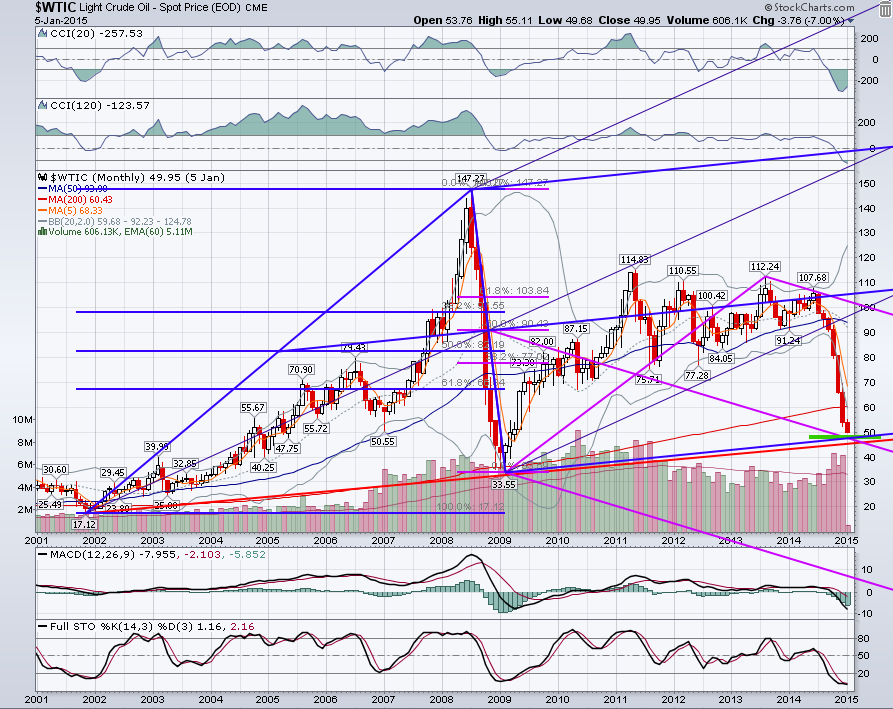
rat, here's my thought for crude. It was amazing to me how it came right back to that TL after the bubble. So, this time I figure they will perhaps take it out and test the previous low in some way, maybe even go nominally below it. There are two key Fib-related lines on there from some work that isn't in the books. Hence, that is my range for testing, from the upper line, give or take, to nominally below the previous low. The USO equivalent is not really possibly because it doesn't track very closely (on the surface it does, or in the very short-term), USO has taken out the 2009 low already, and USO doesn't go back to the 90's so that TL can't be drawn.
Chart created on QCharts, courtesy eSignal
Click image for original size
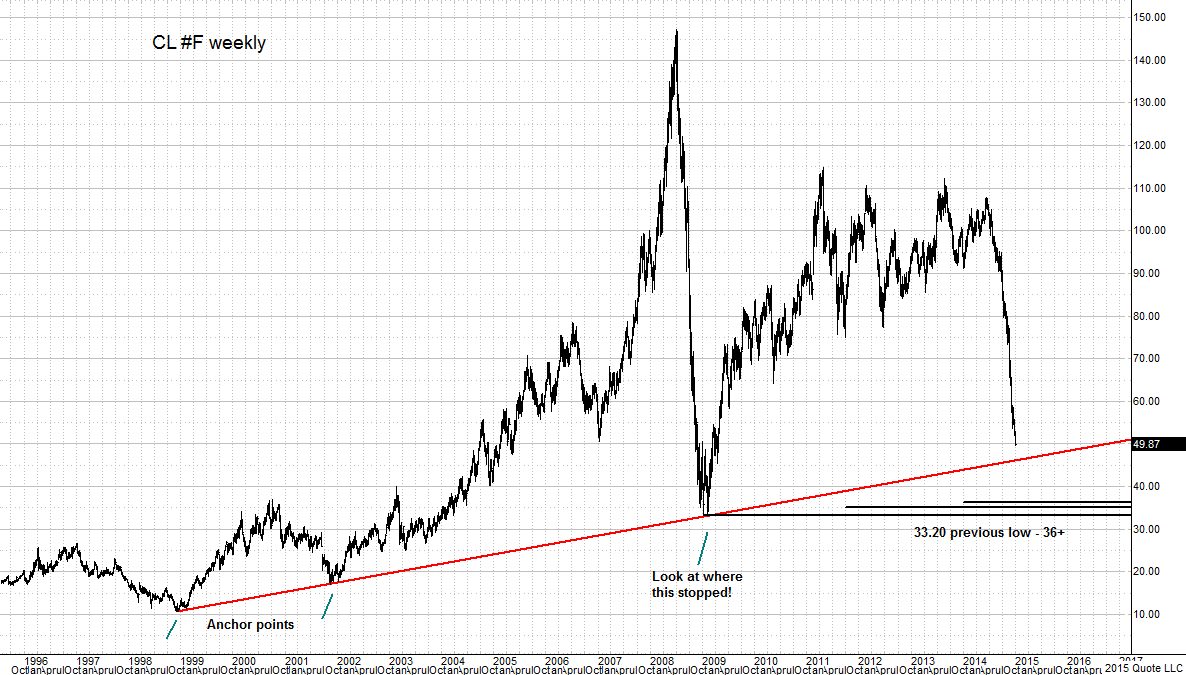
Chart created on QCharts, courtesy eSignal
JI
jimkane
Rep: 3,058
Posts: 33,089
Not a big fan of 'So goes the first week of Jan, so goes the year'? Don't buy that they have said that for the last five years and it has worked?
Originally posted by rat89
if this area were taken out with force, then 110 area for me.....my overall feeling is that this is a bear trap however ;)
Click image for original size
RA
rat89
Rep: 0
Posts: 7,015
lol.....does anyone keep track of how often those predictions work and how often they don't? As an aside, note how the bond experts have been wrong about the year ahead for what, like the last four years? But to answer your question, no. I don't think the relentless bid just goes away, because that's too easy. Maybe in 3-9 months, but not until there is another serious push higher. Everyone was not in at the recent top.....they need to be 95% long ;)
RA
rat89
Rep: 0
Posts: 7,015
thanks jim.....here is my monthly
Click image for original size
Originally posted by jimkane
rat, here's my thought for crude. It was amazing to me how it came right back to that TL after the bubble. So, this time I figure they will perhaps take it out and test the previous low in some way, maybe even go nominally below it. There are two key Fib-related lines on there from some work that isn't in the books. Hence, that is my range for testing, from the upper line, give or take, to nominally below the previous low. The USO equivalent is not really possibly because it doesn't track very closely (on the surface it does, or in the very short-term), USO has taken out the 2009 low already, and USO doesn't go back to the 90's so that TL can't be drawn.
Click image for original size
Chart created on QCharts, courtesy eSignal