MyPivots
Sign In
MA
MarcinO
Rep: 67
Posts: 5,506
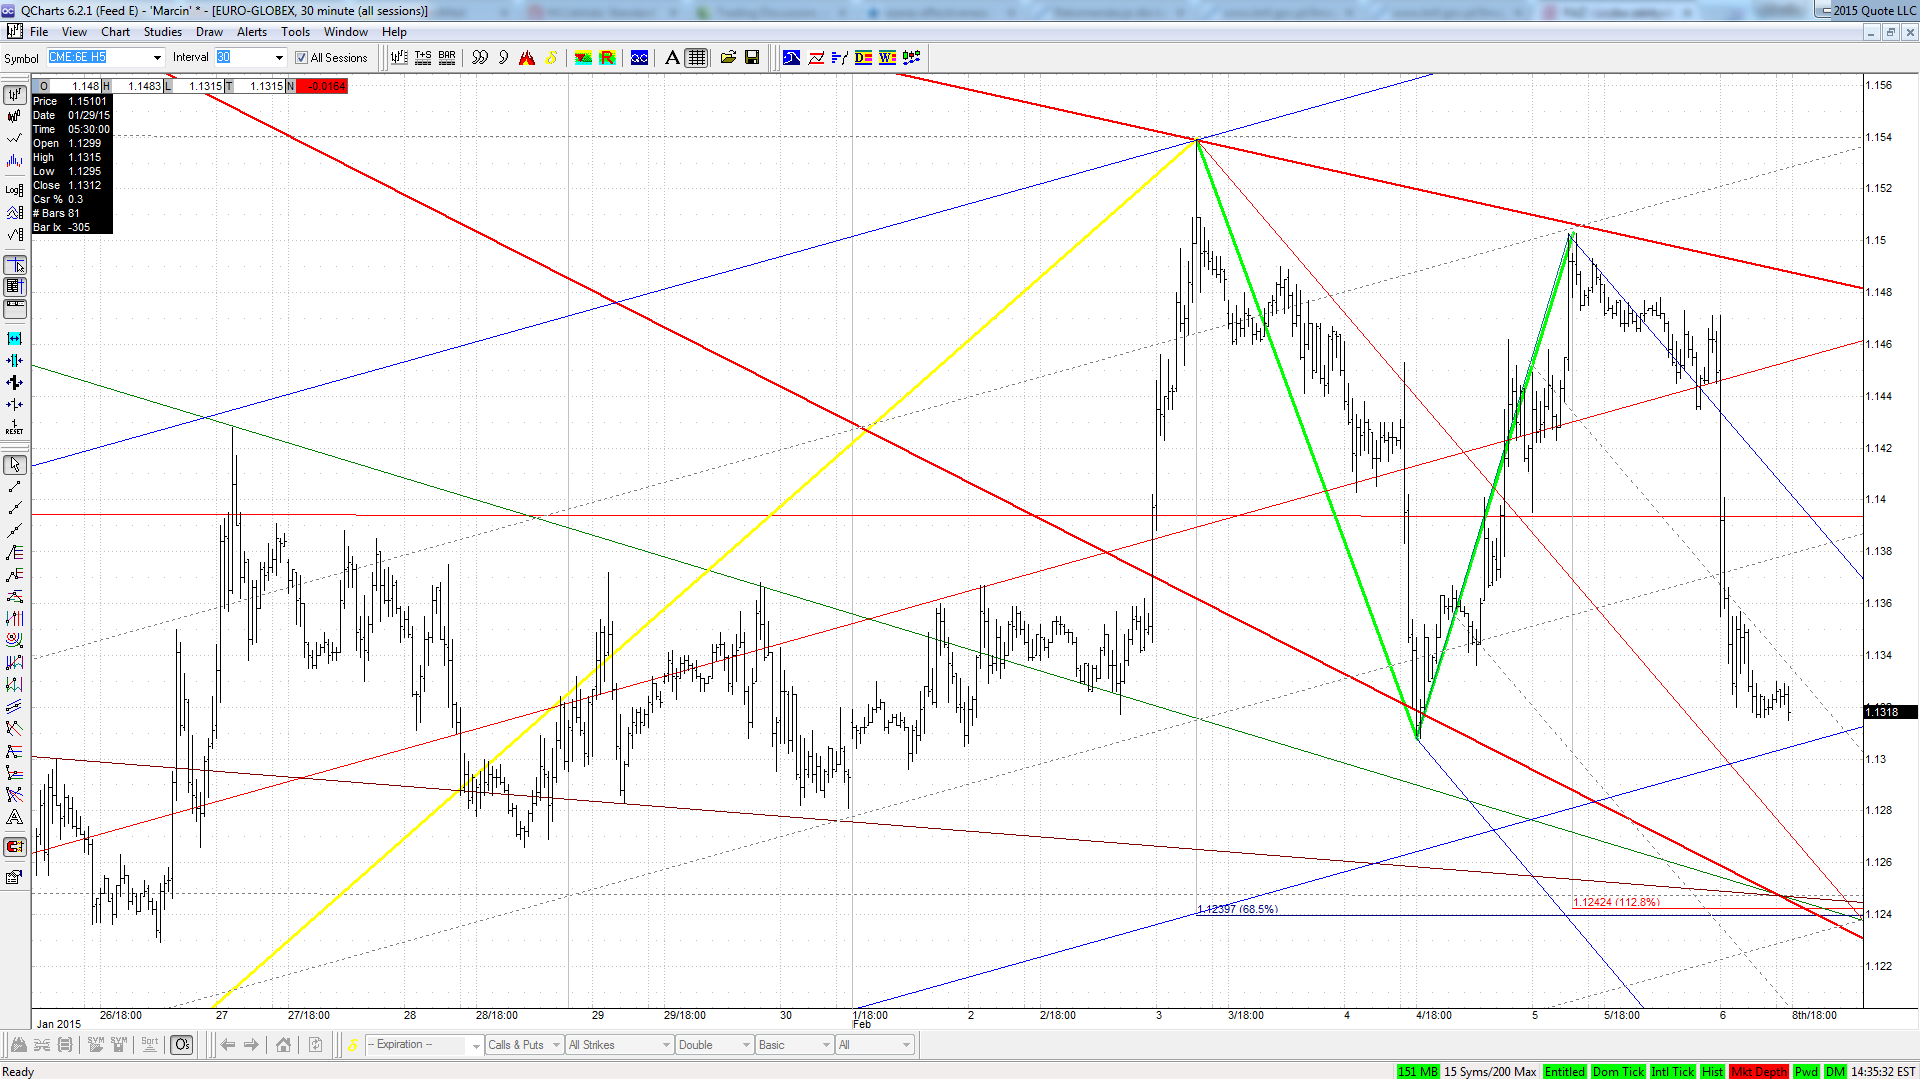
Apart from the area posted on Friday (1.13 and below - .886 ABCD) the Euro may also encounter strong support at 1.1240 (1.128 ABCD).
Since the latter scenario includes a backtest, I guess it is more likely to give a significant reaction.

Click image for original size
6e 2015 02 08 png
JI
jimkane
Rep: 3,058
Posts: 33,089
Greece and the EU reach an agreement 'in principle'. New all-time highs tonight or tomorrow I'd think.
JI
jimkane
Rep: 3,058
Posts: 33,089
Notice how they reach that agreement right off an ABCD....
JI
jimkane
Rep: 3,058
Posts: 33,089
9.25 points from the all-time high. Yeah, like it won't get taken out. Yeah, sure.
JI
jimkane
Rep: 3,058
Posts: 33,089
Time for some news that it isn't true...
MA
MarcinO
Rep: 67
Posts: 5,506
Yes. Euro needs to hit 1.1360 and then fall...
JI
jimkane
Rep: 3,058
Posts: 33,089
"GREEK GOVT OFFICIAL SAYS NO AGREEMENT IN EUROGROUP, GREECE WILL NOT ACCEPT AN EXTENSION OF CURRENT BAILOUT"

Source: http://www.zerohedge.com/news/2015-02-11/futures-eur-surge-report-greek-agreement-reached-principle

So, why hasn't the ES given it all back? Not with those new all-time highs so close you can taste them...

Originally posted by jimkane

Time for some news that it isn't true...
JI
jimkane
Rep: 3,058
Posts: 33,089
First Russia offers to meet with Greece, now China just extended an invitation. Nah, it isn't obvious what is going on here, now is it?
RA
rat89
Rep: 0
Posts: 7,015
jim, i'm not the best person to answer this, but first, this is a 60 minute chart, not a 30. I use 5, 15 and 60 minute charts. My go to cci on the 5 and 15 minute charts for finding divergence at key reversal areas is the cci 40. By displaying multiple cci's on a chart you are in effect looking at multiple time frames. The 120 cci on the 5 minute is the 40 cci on the 15 minute. The 40 cci on the 15 minute is the 10 cci on the 60 minute. I have simply learned from seat time that when I see a double bump on the cci 10 in any time frame, as price reaches a key area, that it is time to go. Roofer would explain this much better than I can, but hope this helps? By the way, years ago, when I identified the fact that the multiple cci's on a 5 minute were showing larger time frames, roofer said I was the first one of his students to make the connection.
Originally posted by jimkane

rat, here's a question I've been asking many people for years, including Scott over at HT, and roofer. No one has been able to answer it for me (or even said 'Hmmm, that's a great question, I have no idea...'), so I continue to completely ignore indicators until I can get an answer. Hopefully you'll be just the guy to do it. Keep in mind, in the early days I spent years using indicators, so I'm no stranger to them.

You show the CCI 10 here, and indicate its position influences your decision making process. But how did you 'know' to view this on a 30-min chart? If you had chosen a 15-min or 60-min, or 120-min chart the CCI 10 would tell you something else completely. Unless one knows how, for each issue, to 'standardize' the choice of timeframe so for a given situation the CCI 10 says the same thing (or any indicator with any parameter), the positioning of the indicator is completely arbitrary. How do you handle this?


Originally posted by rat89

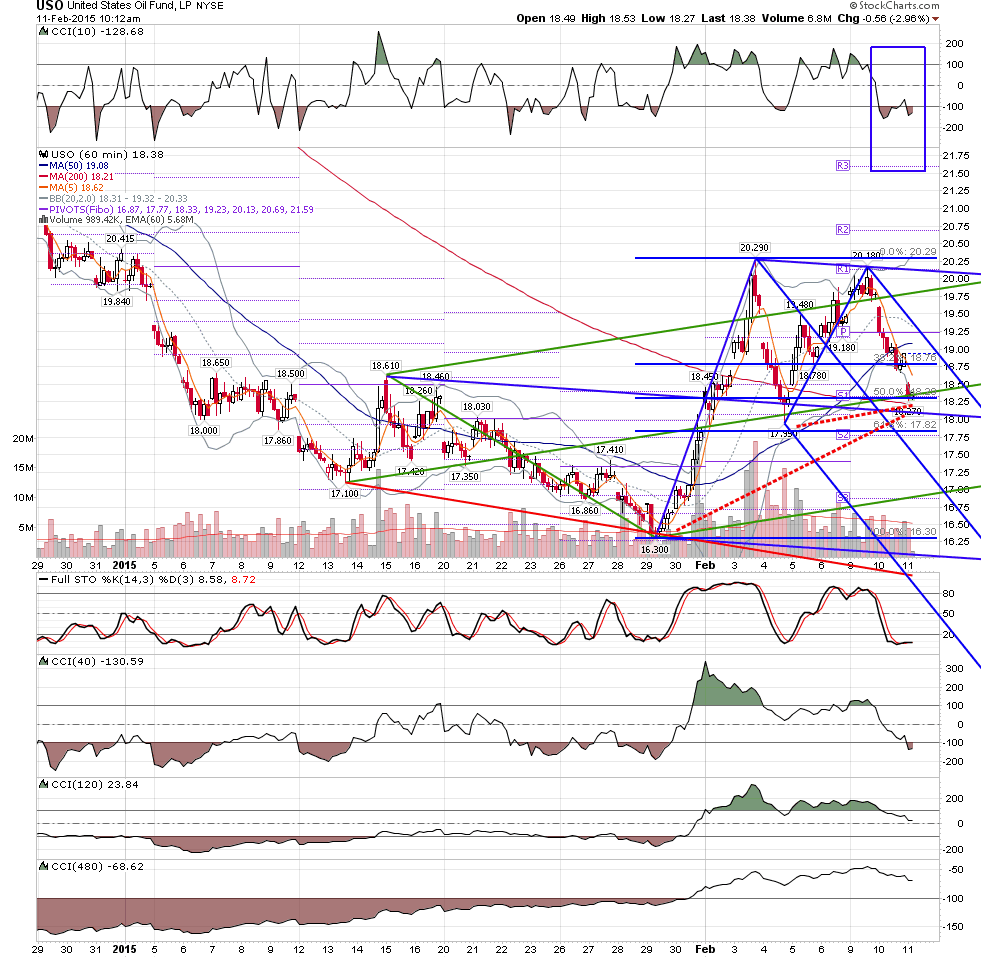
uso 60 - abcd to where 16.30 - 18.29 = .50 at 18.30 and 17.95 - 20.18 = .886 at 18.20......it could go into crash mode, but otherwise I don't trade against the abcd at line with what you see on the cci 10..... I was in sco from 69.85 - 81.30 basis uso 20.02 - 18.28

Click image for original size
screen shot 2015 02 11 at 10 12 07 am png


RA
rat89
Rep: 0
Posts: 7,015
eye on iwm:
121.41 – 114.20 = .886 at 120.59
120.82 – 118.10 = .886 at 120.51
119.84 – 118.62 = 1.618 at 120.59

Intraday today:
120.58 - 120.18 = .883 at 120.53
JI
jimkane
Rep: 3,058
Posts: 33,089
Time to come out of this 1-min range.
JI
jimkane
Rep: 3,058
Posts: 33,089
Mini-session runs for 45 minutes on Friday, and it sets another new all-time high. Gonna be sayin' that a lot...