Actually, rat, I asked roofer many times point blank and not one single time did he even acknowledge my question, no less answer it. I even asked multiple times 'roofer, did you see my question, I really need to understand this' and not once did he acknowledge my follow up. No one addresses this. Think about this to grasp what I am saying. What if on the very same chart you have that pattern covered the entire chart. The CCI 10 would show a very different thing, as it would be very fine for a pattern of that size (assume the price scale was identical (or imagine it wasn't), but the size, as far as time to complete, was much larger). If it had the same double bump its significance to that layout would likely be negligible, comparatively. Now imagine if the pattern was barely visible on that timeframe. Then the CCI10 would be way too coarse, and likely wouldn't ever give any signal, or if so it may be like waiting for a CCI 480.
Think about it like this, since it truly does work the same way. Imagine an entry trigger as a moving average crossover (I know moving averages and oscillators are completely different techniques, and I've traded both for years, so I have a great feel for them), say a 10 ema, 20 sma, just to pick something. Now imagine I showed a 15-min chart showing my entry was just triggered. Someone asks how I knew to do this on a 15-min chart. They show a 60-min chart and show it hasn't triggered yet, and a 5-min chart and show it triggered long ago. What if I reply well, look at 30 ema, 60 sma on that 5-min, I'll bet it's just triggering right now! See? But, alas, that begs the question how did I know to use the 15-min? Now imagine using that chart but the pattern is much bigger on the chart than this case. Or much smaller. Well, then use different moving averages. Which ones? And so on.
Yes, the CCI 10 (or stochastics, or RSI, or...) may show a divergence, or a double bump, but change the timeframe and watch what happens. I've tried for years to understand this, or even get an answer from any practitioner, and I can't get one. I've had this discussion at length with Scott over at HT with his RSI BAMM technique, which does the same things as this CCI approach, and couldn't even get him to address it, just like roofer. Dead silence. I wish I could understand this better... The one answer that maddens me is 'Well, it works for me. If it doesn't work for you, don't use it'. Yeah, that helps me understand the mechanics of what is happening.
I know this is belabored, but I am hoping it helps you better grasp what I am trying to understand, or triggers someone else to be able to help me. Here's the study I did that leads me to this point. I worked with many indicator traders in the early days. They talked about the sheer power of divergences. So, a setup happened, and they waited for a divergence. No divergence, no trade. They set up with enough frequency. They took the trades. The results were whatever they were. I looked at all the setups that had the divergence, and all that didn't. I discovered zero correlation (well, statistically insignificant correlation) of the groups with and without the divergences. The trades did what they did. But, the indicator traders insisted that this was due to the indicator filtering. So, I could trade 100% of the setups, and they could only trade a subset because they filtered based on this awesome divergence. I studied this for both positive and negative divergences, and found they had no meaning whatsoever for the setups I was looking at.
I am in no way saying the CCI technique you use and roofer pioneered doesn't work, or isn't awesome. I'm just saying, for me, if I have a trigger and don't see the CCI 10 bump, I can't pass that up, as my experience says it's go time. If my techniques say it hasn't triggered yet, but I see a CCI 10 bump and that tells me I should go, I switch the timeframe a bit, and the bump is gone. Then what do I do? Until I understand all that, I can't use it. The problem for me, even though I know you, rat, quite well from the years in here, and roofer even longer, is that this sounds no different to me than Scott or the indicator traders who insisted to me their divergence was the key to their success, and they could show me with endless charts how that divergence was just perfect before all their trades. Again,
I am not saying this CCI technique is ineffective like those others, only that I am unable to see how it is any different from what has been presented to me.
This reminds me of a discussion I have over and over with my neighbor (and some relatives). He says his god is the one true god, and everyone who chooses another god will burn forever. I said the problem for me is, all the people from all those other gods have exactly the same argument, that their's is the one true god, and all the followers of the others will burn forever. I say to him, how do I know you are right, and I get things like 'You've known me for how many years? Have I ever lied to you or steered you wrong? It works for me, I have endless examples. You can trust me.' The problem is, this is the identical argument all the others told me. For me, how can I tell, then? I can't. But, I want the truth, the one true god, not just a belief it is the one true god. I want to know a technique works, it stands up to scrutiny, and for that I have to at least understand it, or have evidence it works. That's why I seek help here...
Originally posted by rat89
jim, i'm not the best person to answer this, but first, this is a 60 minute chart, not a 30. I use 5, 15 and 60 minute charts. My go to cci on the 5 and 15 minute charts for finding divergence at key reversal areas is the cci 40. By displaying multiple cci's on a chart you are in effect looking at multiple time frames. The 120 cci on the 5 minute is the 40 cci on the 15 minute. The 40 cci on the 15 minute is the 10 cci on the 60 minute. I have simply learned from seat time that when I see a double bump on the cci 10 in any time frame, as price reaches a key area, that it is time to go. Roofer would explain this much better than I can, but hope this helps? By the way, years ago, when I identified the fact that the multiple cci's on a 5 minute were showing larger time frames, roofer said I was the first one of his students to make the connection.
Originally posted by jimkane
rat, here's a question I've been asking many people for years, including Scott over at HT, and roofer. No one has been able to answer it for me (or even said 'Hmmm, that's a great question, I have no idea...'), so I continue to completely ignore indicators until I can get an answer. Hopefully you'll be just the guy to do it. Keep in mind, in the early days I spent years using indicators, so I'm no stranger to them.
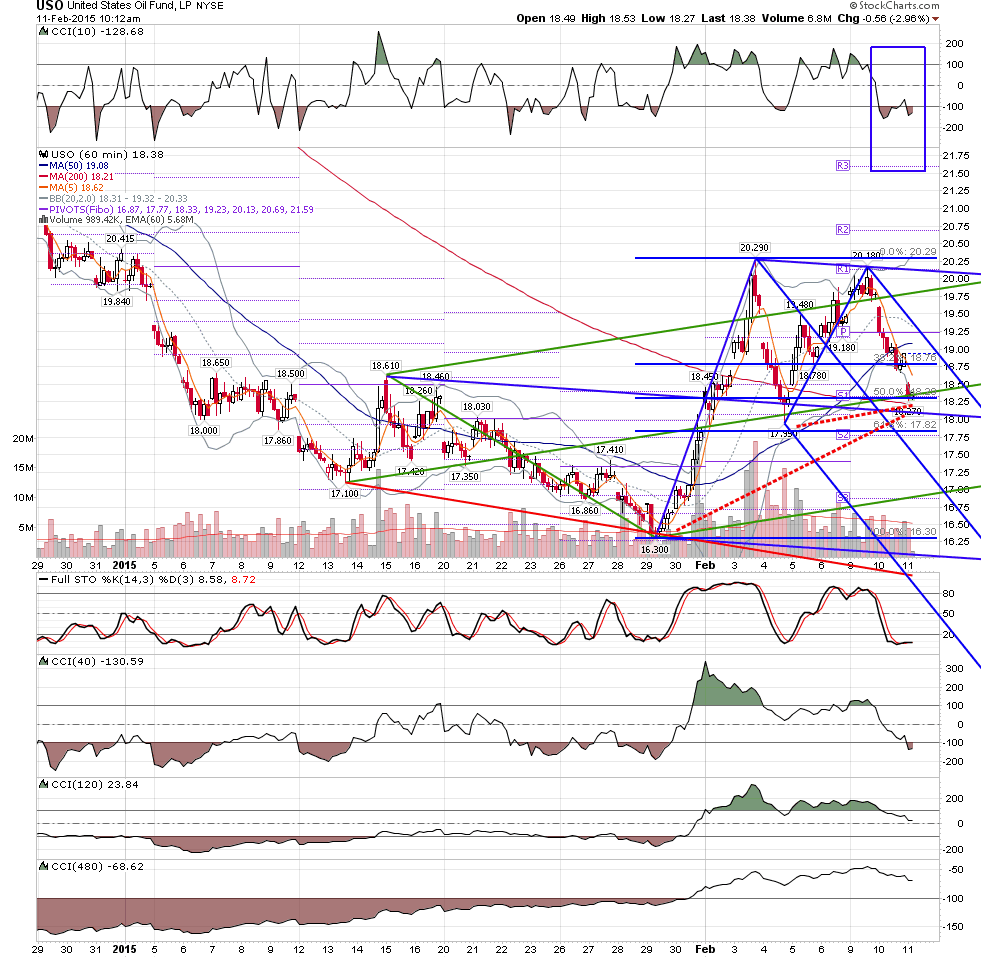
You show the CCI 10 here, and indicate its position influences your decision making process. But how did you 'know' to view this on a 30-min chart? If you had chosen a 15-min or 60-min, or 120-min chart the CCI 10 would tell you something else completely. Unless one knows how, for each issue, to 'standardize' the choice of timeframe so for a given situation the CCI 10 says the same thing (or any indicator with any parameter), the positioning of the indicator is completely arbitrary. How do you handle this?
Originally posted by rat89
uso 60 - abcd to where 16.30 - 18.29 = .50 at 18.30 and 17.95 - 20.18 = .886 at 18.20......it could go into crash mode, but otherwise I don't trade against the abcd at line with what you see on the cci 10..... I was in sco from 69.85 - 81.30 basis uso 20.02 - 18.28
Click image for original size