The most basic and profitable method ever. Grid trading
I have tried for the last 15min to post a chart. I must say my computer skills are seriously lacking (almost like my English), but if you all will bear with me ill explain a concept that sounds so basic most will dismiss as nonsensical. But it is price action in its rawest form and is my holy grail.
Most here trade the ES. This works well with es. It works well with any market oil, gold, silver, wheat, tf, 10yrs you just need to tweek it until it fits your style. And its more for the scalper.
1) take a chart of ES 5min. and draw horizontal lines every 2.5 points (100,102.5, 105,107.5, 110). it has been slow lately, I used to have them every 5pts, but low average true range has been low so like I said is left up to some tweaking. So when the market speeds up to every 5pt levels. You should know what I mean or at least I hope you know what I mean.
2) when markets move above this horizon and ''closes above'' this is a signal bar look for longs 1 tick above this bars high.
3) 50 points on dow works wonders, usd/jpy 10pips, oil .50, notes every 8 ticks. nq at the moment is pts.
closing remarks I know this sounds like ''really'' but it is what I do day in and day out. I started with this it work great went to the stars and back (no literally) price action is the only way to trade. If someone could please post a chart I will explain father.
*should have edited ''went to the stars and back'' what I meant was I originally traded like this but added all sorts of things to it even astrology. and found out more isn't always better.
Hi Joe,
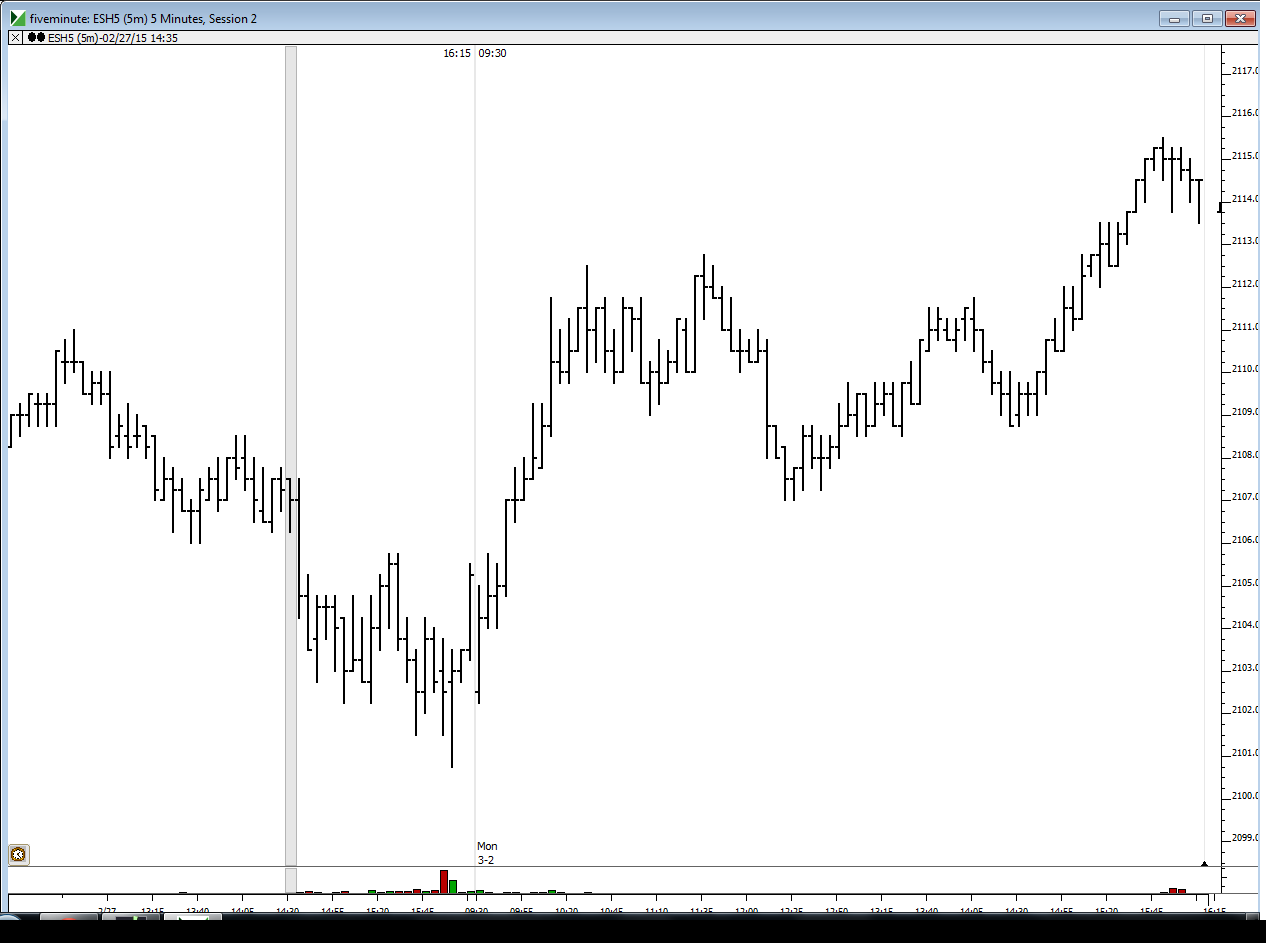
Nice to "see' you . I hope all the family is well. here is a 5 minute for today and part of Friday. Glad to c ya posting again.
Nice to "see' you . I hope all the family is well. here is a 5 minute for today and part of Friday. Glad to c ya posting again.
Click image for original size
look AT USD/JPY open sell signal 120.175
120.09
119.95
119.75
Asia open in free fall. Remember usd/jpy 10 pip levels all beautiful shorts
120.09
119.95
119.75
Asia open in free fall. Remember usd/jpy 10 pip levels all beautiful shorts
all those numbers trade below and close below 10pip levels.
hi bruce. hope yall have been well too.
If you look at bruces chart of the es late day buys @ 2110,2112.5+ closes (one tick above witch we went long) and the 2115 which was the 10th highier high(5min count) if I recall and was super late in the day session so should have been passed up lol.
Originally posted by CharterJoe
I have tried for the last 15min to post a chart. I must say my computer skills are seriously lacking...
Let me know if you want me to do a quick Skype screen share with you and I can show you how to post a chart.
Do you start your 1st line at a certain number, ie. 10.00?
Just a thought. Since the lines are irrelevant, have you tried a "truer" price action? 5M closes green take continuation above high? Seems to look promising, particularly in the 1st hour RTH.
Good luck to all.
Good luck to all.
yes mike 119.00 119.10 119.20 ect ect and the numbers have no relevance or special support and resistance powers. it only takes a consistently moving auction and helps with the question of where has price been and where is it trying to go.
Emini Day Trading /
Daily Notes /
Forecast /
Economic Events /
Search /
Terms and Conditions /
Disclaimer /
Books /
Online Books /
Site Map /
Contact /
Privacy Policy /
Links /
About /
Day Trading Forum /
Investment Calculators /
Pivot Point Calculator /
Market Profile Generator /
Fibonacci Calculator /
Mailing List /
Advertise Here /
Articles /
Financial Terms /
Brokers /
Software /
Holidays /
Stock Split Calendar /
Mortgage Calculator /
Donate
Copyright © 2004-2023, MyPivots. All rights reserved.
Copyright © 2004-2023, MyPivots. All rights reserved.