ES Wednesday 9-2-15
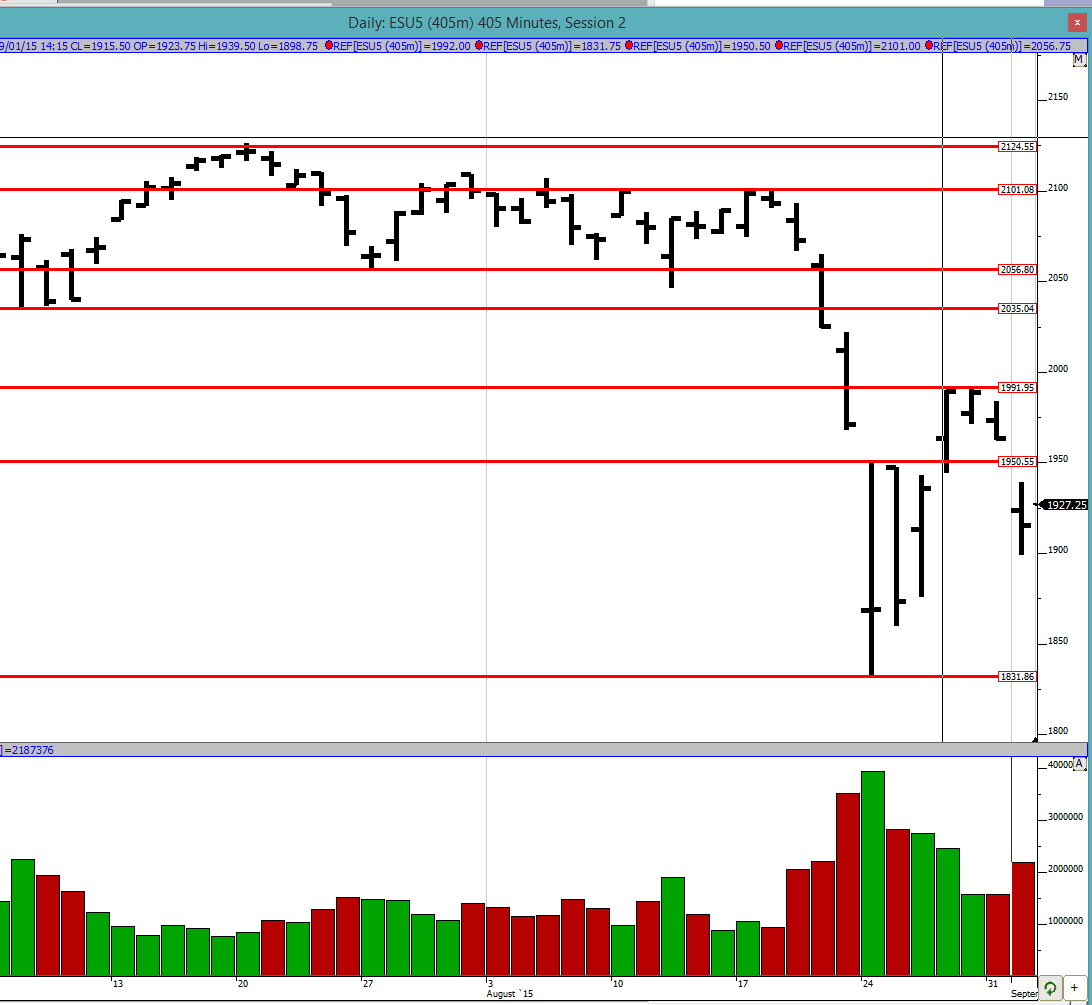
Good evening to all. Today we gapped down and were unable to close the gap. We ended up in the previous balance area of 1831 to 1950.5. we shall see if we get to the bottom end of this balance area in the near future at 1831 or not. keep in mind that we could likely close today's gap before continuing lower so I am not saying we get there tomorrow or at all, but that there is a likelihood that it could get there. All we do is look at probabilities and then look at price action. Predicting a market is a fool's errand.
Greenies: 1894, 1918.25, 1927.25, 1969.5, 1979, 1995, 2014.25, 2053.25, 2077.75
Profile:
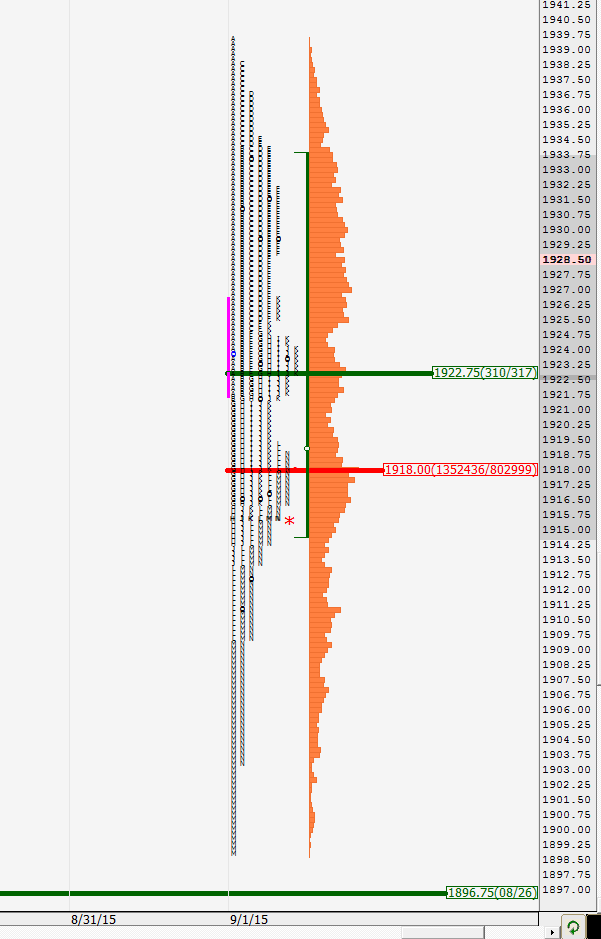
I had to scale my y-axis to make the entire profile fit in 1 page so I apologize for the small text. We can see that there is a good buying tail at the low end with the market rallying hard in the last 30 mins or so. Again, the VPOC which was higher became a magnet towards the close and pulled prices towards it. It is interesting to note that the VPOC of 1918 is close to the mid-pt of the day (1919). The market closed pretty close to it at 1915.5. The value was clearly lower today compared to Monday with the inability to close the gap.
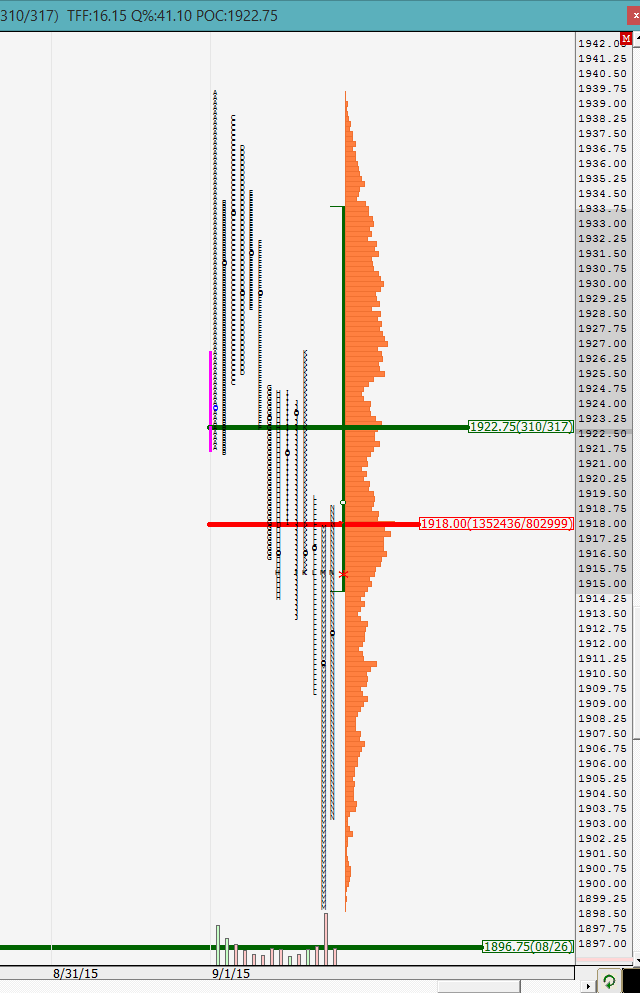
On the split profile we can see how the market kept trying to go up in the C period and could not take out A period high. Then the D period could not take out the C period high and the E period could not take out the D period high. The buyers kept coming in at lower levels but the buying simply exhausted as they moved up in price unable to take out the previous 30 min period highs. This was creating the wedge that I mentioned in the Monday trading notes. Finally when the F period came by and could not take out the E period high, the buyers finally threw in the towel and we had liquidation rest of the day with shorts piling on. There was some respite in the K period but that just seemed to be inventory adjustment with the selling commencing again until the last 30 mins or so when the market got too short and we had some frantic short covering towards the close driving prices back up to the VPOC. This is all very simple stuff as long as we can keep up with it in real time. Today I saw it more as the wedge play than the profile play but the end result is what matters. This also goes to show that no matter the approach, they all usually point at the same thing.
We shall see how the O/N plays out and come up with a plan in the morning. There are no major economic reports tomorrow.
Greenies: 1894, 1918.25, 1927.25, 1969.5, 1979, 1995, 2014.25, 2053.25, 2077.75
Click image for original size
Profile:
I had to scale my y-axis to make the entire profile fit in 1 page so I apologize for the small text. We can see that there is a good buying tail at the low end with the market rallying hard in the last 30 mins or so. Again, the VPOC which was higher became a magnet towards the close and pulled prices towards it. It is interesting to note that the VPOC of 1918 is close to the mid-pt of the day (1919). The market closed pretty close to it at 1915.5. The value was clearly lower today compared to Monday with the inability to close the gap.
Click image for original size
On the split profile we can see how the market kept trying to go up in the C period and could not take out A period high. Then the D period could not take out the C period high and the E period could not take out the D period high. The buyers kept coming in at lower levels but the buying simply exhausted as they moved up in price unable to take out the previous 30 min period highs. This was creating the wedge that I mentioned in the Monday trading notes. Finally when the F period came by and could not take out the E period high, the buyers finally threw in the towel and we had liquidation rest of the day with shorts piling on. There was some respite in the K period but that just seemed to be inventory adjustment with the selling commencing again until the last 30 mins or so when the market got too short and we had some frantic short covering towards the close driving prices back up to the VPOC. This is all very simple stuff as long as we can keep up with it in real time. Today I saw it more as the wedge play than the profile play but the end result is what matters. This also goes to show that no matter the approach, they all usually point at the same thing.
Click image for original size
We shall see how the O/N plays out and come up with a plan in the morning. There are no major economic reports tomorrow.
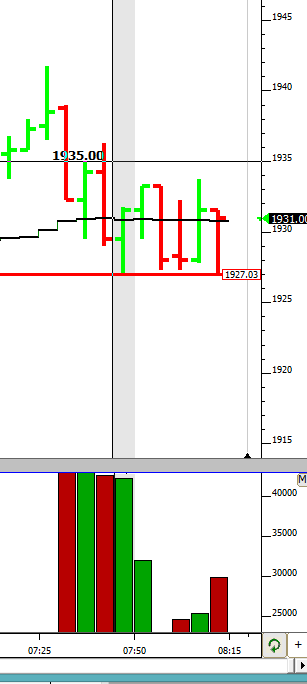
more weak buying from the lows again... this is going down!
a chart showing the weak buying with a line drawn threw the low. see how the buyers keep coming back at the lows. the membrane is getting weaker everytime the market goes there
Click image for original size
lows taken out and now we are the O/N mid-pt... i think the inventory is now adjusted and now the market will show it's real hand. should be interesting to see what happens now
YD's VPOC/greenie at 1918 and close at 1915.5
1918 arrival... but volume looks thin getting there. how far will the bounce go? all the way to VWAP/VPOC of 1930? be careful out there...
meanwhile crude is retreating from its biggest 3 day rise in history ...
ES is likely tracking crude and getting dragged down by it... thanks for the update because i dont track crude
Originally posted by jimk
meanwhile crude is retreating from its biggest 3 day rise in history ...
tiny volume 27-29. Strong resistance ?
i would not say strong but some resistance. BruceM is a master of LVNs and he usually trades off of them.
Originally posted by jimk
tiny volume 27-29. Strong resistance ?
i m out at 26
end of the day stop hunting.... typical! :) have a good evening to all
Emini Day Trading /
Daily Notes /
Forecast /
Economic Events /
Search /
Terms and Conditions /
Disclaimer /
Books /
Online Books /
Site Map /
Contact /
Privacy Policy /
Links /
About /
Day Trading Forum /
Investment Calculators /
Pivot Point Calculator /
Market Profile Generator /
Fibonacci Calculator /
Mailing List /
Advertise Here /
Articles /
Financial Terms /
Brokers /
Software /
Holidays /
Stock Split Calendar /
Mortgage Calculator /
Donate
Copyright © 2004-2023, MyPivots. All rights reserved.
Copyright © 2004-2023, MyPivots. All rights reserved.