ES 5-2-16 and other See I told ya so numbers
Gonna post this video for those who may be trading post 9 a.m and will edit to include my can't fail S.I.T.Y.S ( see i told ya so ) numbers.. 64 - 67 is first key short zone and we missed the Overnight midpoint in Fridays trade...a low probability we fail at Overnight midpoints two days in a row and weakness on Friday usually spills to Monday at least early on. So getting short. Keep in mind that there is a high probability we hit one of the weekly numbers as per pivot formula and the closest one is at 67 but that is auto generated...I'm using 64 - 67 as a short zone !!
ok here are numbers that have a 99 % chance of hitting. The problem is you don't know which ones will hit and neither do I . Perhaps this is no better than saying the market will go up or down but some folks are good breakout and trend traders so these would be targets if you had a good signal. I'm going to refer back to this post and say " See I told ya so" when they do hit....like a child, for fun !!!!
ok by months end we will print 2139 and/or 1978
by weeks end we will print 2098 and/or 2018
the idea behind these would really be to take trades on smaller times frames in an attempt to hold for longer term targets. For example, if you get a good short today then it might be worth trying to hold something to target the 2040 since my S.I.T.Y.S ( "see I told ya so" - said in a snotty kids voice) will hit 99% of the time ! Or if we start holding above the 64 - 67 zone and you think you have a good WEEKLY long then it might be worth trying to hold for 2078 !
For even smaller time frame traders TODAY we have 67 and 2050 as our S.I.T.Y.S numbers ! and gaps count so if we were to gap open above 67 then I would consider that 67 to have traded and count as hitting.
"see I told ya so " !!! Fun stuff but these are targets ( not for me because I have not been long today) and are not really meant as S/R numbers unless something else is there ...had a great winner on short today, had a small loser on second short and will try one more small ( very small short )in the 69 - 70 area if I see something I like....otherwise that will be it for me....only 36 minutes left in my trading window of time...the closer we can take the short to 2070 then the less risk we have if we are wrong..more conservative traders will wait till we get some reaction at overnight high retest ...any shorts will go to 66.50 as a target and will clean up the small loser and make a profit
Originally posted by BruceM
For even smaller time frame traders TODAY we have 67 and 2050 as our S.I.T.Y.S numbers ! and gaps count so if we were to gap open above 67 then I would consider that 67 to have traded and count as hitting.
they tested the Overnight high before I could get an entry and didn't officially print to the 69 - 70....so shorts if we make new highs are not attractive to me now...I may try to buy under overnight high near 65 expecting new highs as we have not fulfilled the Daily pivot probability of hitting one of the pivot numbers and that would be 2070 or 2058. If trading this slow stuff be nimble and if we can't get back out of the O/N high quickly they can easily flip this back down to 62.75 and then even try once again for the PIVOT instead of the 70 number......in general I'd be thinking like this ...... we have the dividing line at 64...that splits the R1 and pivot today so many small fry traders like myself are watching that and that is a key swing from Fridays afternoon highs too
coming out heavy at 67.50 to make up small loser on second campaign...will try to hold last pieces for new highs but don't think they will give this to me so easy
got stopped at entry at 64.50 on runners (my entry)...sure is looking like they may go for the 58 and only spending time above Overnight high will change that... I'm done....3 campaigns...one good , one small loser and one small winner......one of many reasons I like the first 90 minutes is because we can use references that are static.....the more time the market trades then more information flows in and then there are those that trade from both dynamic and static points on the charts and will sit here all day trying to catch the moves........well, that may work for them but not for me.......been there and done that and have also given back gains that way too....you grow weary and feel like you "have to" trade because you've been sitting on your ass so long and think the market needs to pay you for it...
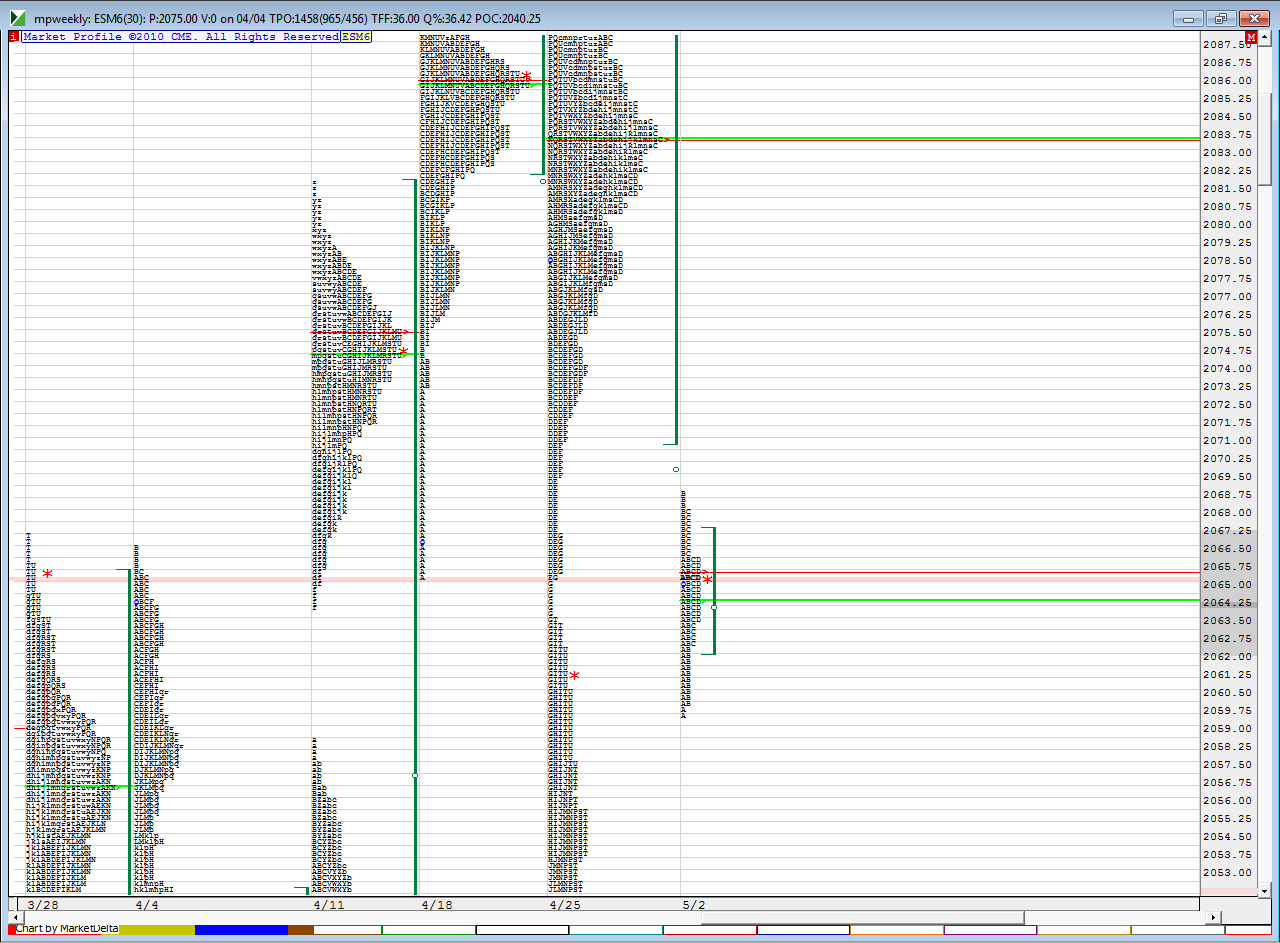
I wanna get paid in the first 90 minutes !! Time is building in the 64 area...the breakdown point from that weekly low.....this can go either way and I don't have a good feel for which way anyway...I hope it goes the way YOU need it to go !
I wanna get paid in the first 90 minutes !! Time is building in the 64 area...the breakdown point from that weekly low.....this can go either way and I don't have a good feel for which way anyway...I hope it goes the way YOU need it to go !
a chart showing how the profile is building today against that 64 area...
Click image for original size
yes i sold it at 2070.50 and took loss at 2070.75.if wondering.
my reason for buying back..most times when i sell the number it moves away from it in less 3 min time.i can get one point profit quick.use point on my stop on last contract..i know not perfect but its keep me alive to trade again.lol
statistically we will need to come back through 2071 as we do NOT usually leave just one set of 30 minute tpo's at a weekly value area low or high,... this statistic doesn't give the "WHEN" of the event happening. It's raining and I've stopped my outside fun and I'm hoping to get some small shorts off the 74 - 76 area...not only do we have some price action there but also the one standard deviation band is up here....I sure wish I didn't have that SITYS number up at 78.25 ...I'd have a bit more confidence if that number wasn't so close by....but will try light trades up here as this is not my favorite time of day and I put in my 90 minutes already...71 is my magnet on the shorts....good luck from here
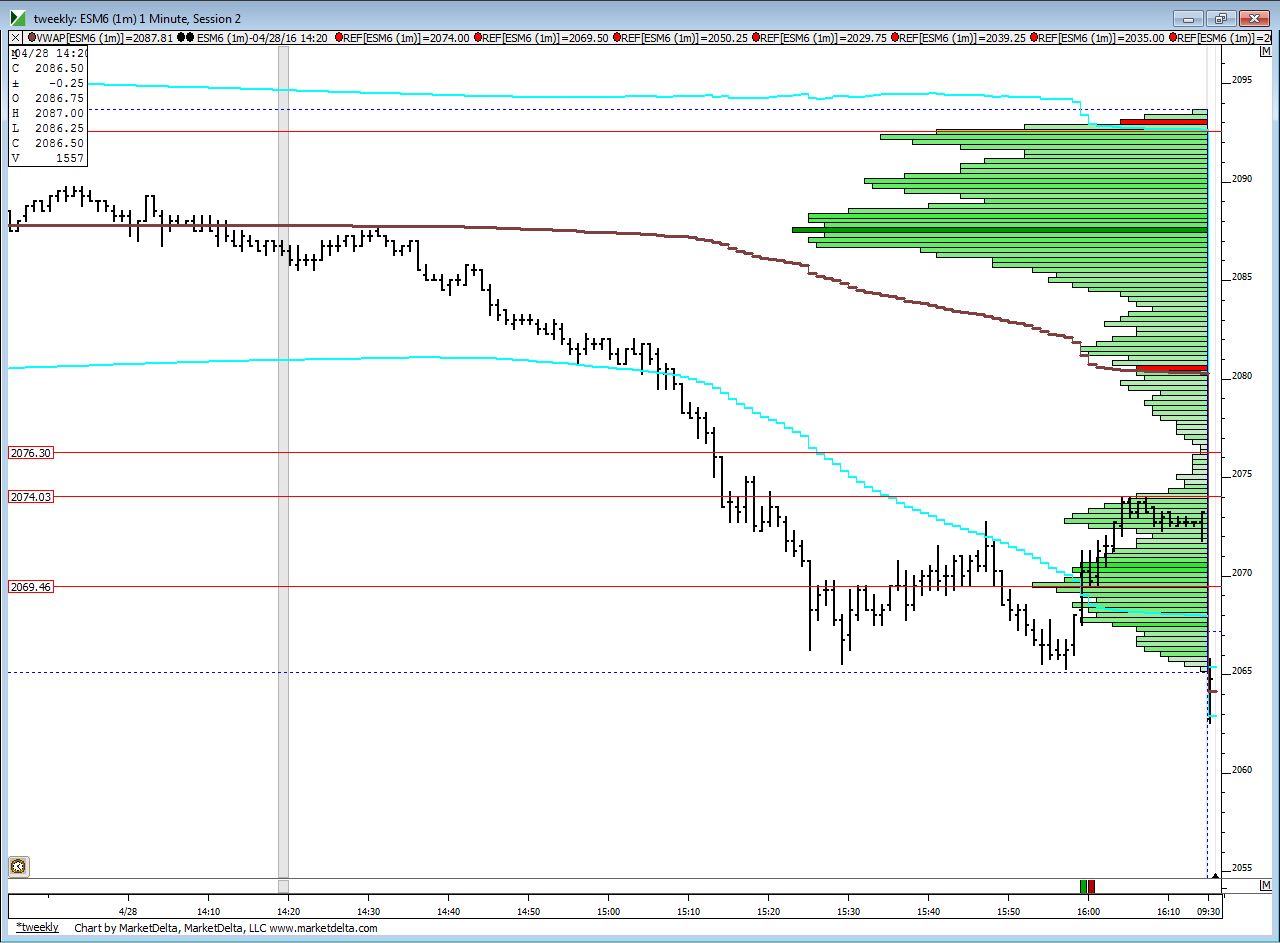
two for the road...note the price action ( the swing high at 74 ) and the low time spot at 76.25 from Thursdays trade...the time histogram helps me define the price action areas quite often
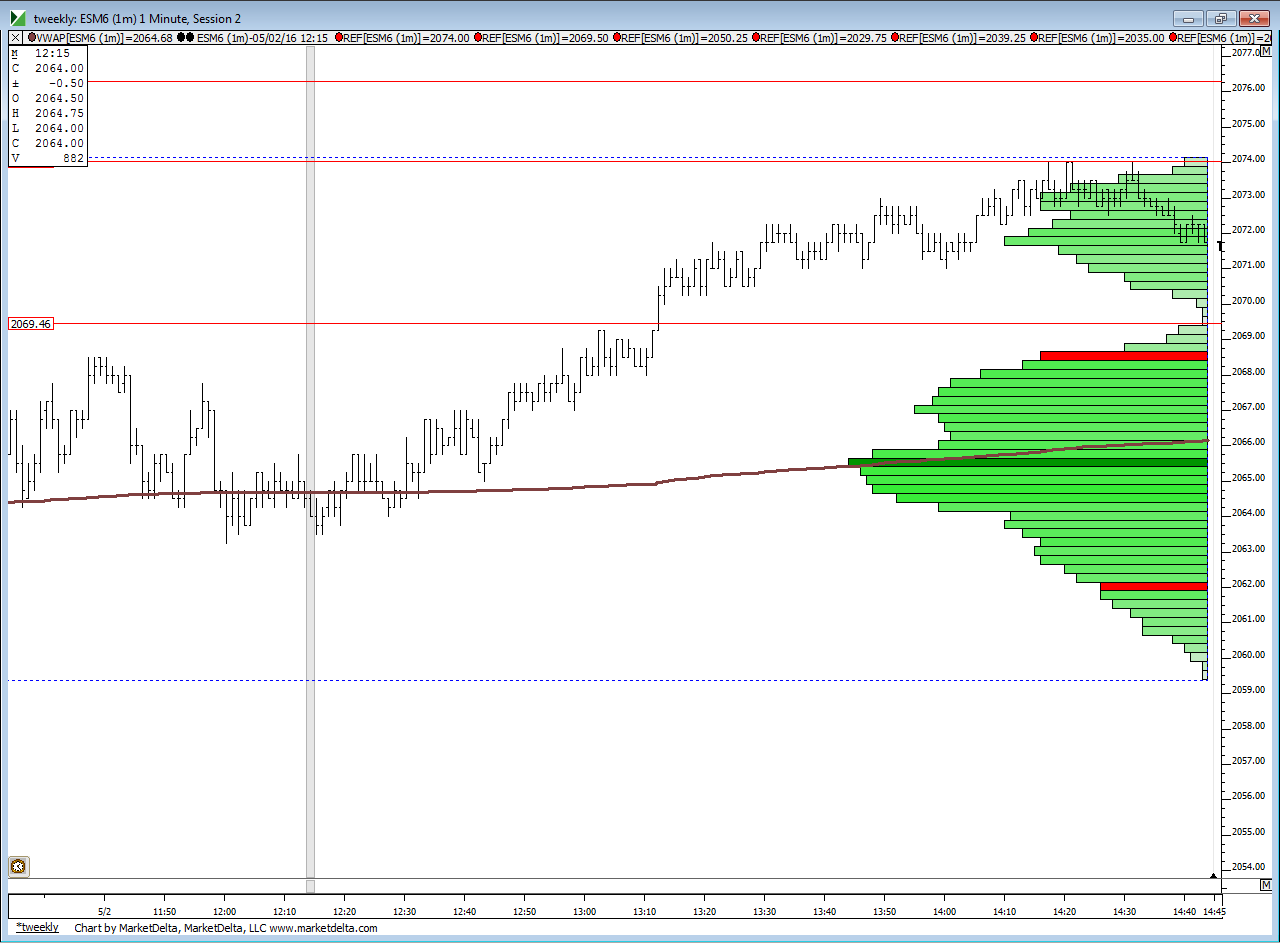
and here is today...note the low time at 69.50.....I'd like to see them drop down but will come out if given the chance ahead of that low time area
Click image for original size
and here is today...note the low time at 69.50.....I'd like to see them drop down but will come out if given the chance ahead of that low time area
Click image for original size
Emini Day Trading /
Daily Notes /
Forecast /
Economic Events /
Search /
Terms and Conditions /
Disclaimer /
Books /
Online Books /
Site Map /
Contact /
Privacy Policy /
Links /
About /
Day Trading Forum /
Investment Calculators /
Pivot Point Calculator /
Market Profile Generator /
Fibonacci Calculator /
Mailing List /
Advertise Here /
Articles /
Financial Terms /
Brokers /
Software /
Holidays /
Stock Split Calendar /
Mortgage Calculator /
Donate
Copyright © 2004-2023, MyPivots. All rights reserved.
Copyright © 2004-2023, MyPivots. All rights reserved.